The ChartDirector Zooming and Scrolling Framework is a framework for "logical zooming" of charts. "Logical zooming" means the chart is plotted with more details as it is zoomed in, but the chart objects do not necessary become bigger. The font size, line width, symbol size, etc, may remain the same. The chart may change type or use different data when it is zoomed in. For example, for a finance chart, it may start as a daily candlestick chart when the time range is long, and becomes a realtime intraday line chart when zoomed to one day.
The main elements of the ChartDirector Zooming and Scrolling Framework include a click and drag user interface to control zooming and scrolling, a set of methods to manage axis scales, and AJAX support to allow updating charts without refreshing the web page.

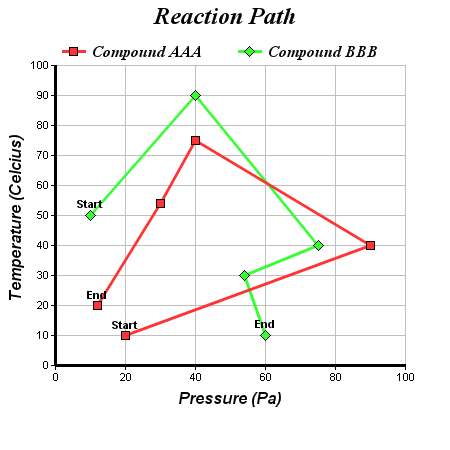
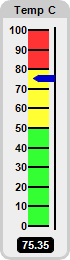
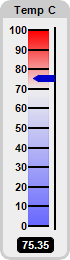
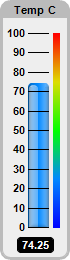
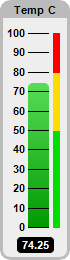
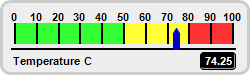
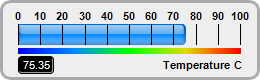
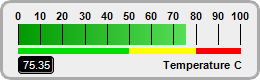
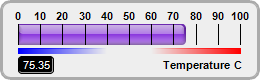
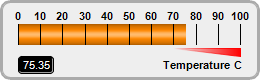
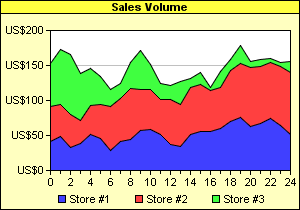
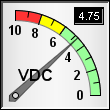
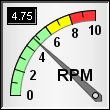
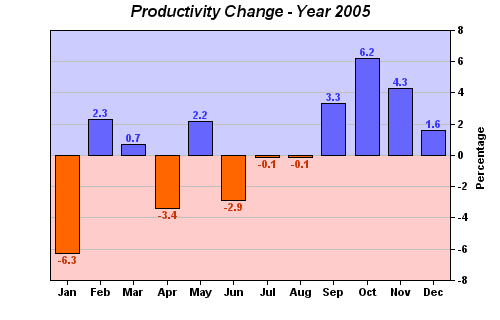
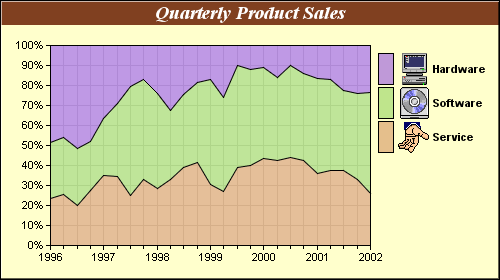
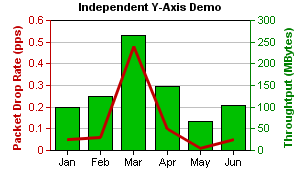
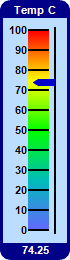
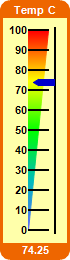
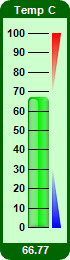
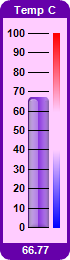
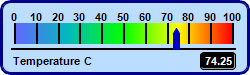
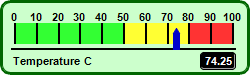
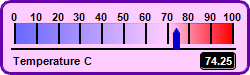
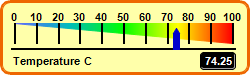
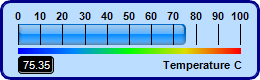
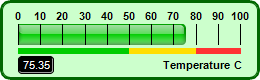
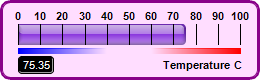
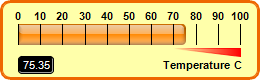
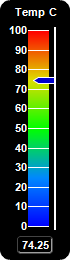
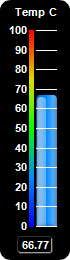
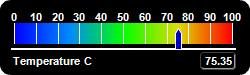
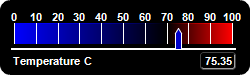
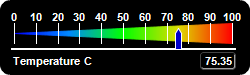
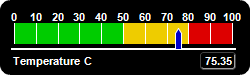
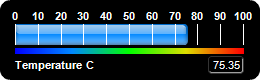
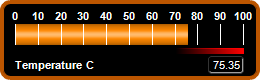
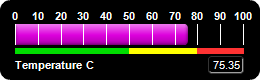
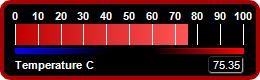
This example demonstrates using y zone colors - colors that change at certain y value thresholds.
In this example, a y zone color is used as the fill color of an area layer, so that the area fill color changes above a certain threshold.
Y zone colors are created using Layer.yZoneColor. You can use a y zone color in any ChartDirector API that expects a color. For instance, you can use a y zone color as background color, fill color of data sets, line color, etc.
A single y zone color can support one threshold value and change between two colors. The two colors can be any colors, including another y zone color. You may create y zone colors with multiple thresholds by cascading multiple y zone colors this way.


