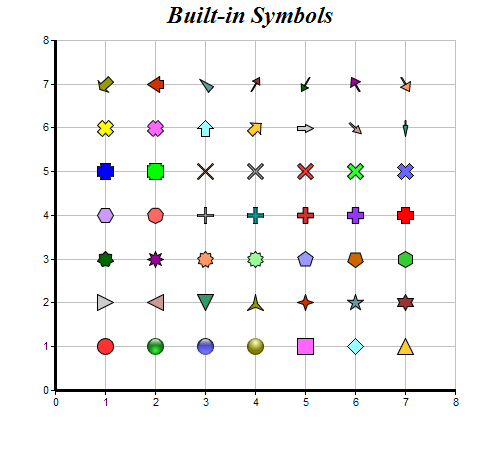
This example demonstrates the built-in symbols supported by ChartDirector.
ChartDirector 6.0 (ColdFusion Edition)
Built-In Symbols
Source Code Listing
<cfscript>

// ChartDirector for ColdFusion API Access Point
cd = CreateObject("java", "ChartDirector.CFChart");

// A utility to allow us to create arrays with data in one line of code
function Array() {
    var result = ArrayNew(1);
    var i = 0;
    for (i = 1; i LTE ArrayLen(arguments); i = i + 1)
        result[i] = arguments[i];
    return result;
}

// Some ChartDirector built-in symbols
symbols = Array(cd.CircleShape, cd.GlassSphereShape, cd.GlassSphere2Shape, cd.SolidSphereShape,
    cd.SquareShape, cd.DiamondShape, cd.TriangleShape, cd.RightTriangleShape, cd.LeftTriangleShape,
    cd.InvertedTriangleShape, cd.StarShape(3), cd.StarShape(4), cd.StarShape(5), cd.StarShape(6),
    cd.StarShape(7), cd.StarShape(8), cd.StarShape(9), cd.StarShape(10), cd.PolygonShape(5),
    cd.Polygon2Shape(5), cd.PolygonShape(6), cd.Polygon2Shape(6), cd.Polygon2Shape(7),
    cd.CrossShape(0.1), cd.CrossShape(0.2), cd.CrossShape(0.3), cd.CrossShape(0.4), cd.CrossShape(
    0.5), cd.CrossShape(0.6), cd.CrossShape(0.7), cd.Cross2Shape(0.1), cd.Cross2Shape(0.2),
    cd.Cross2Shape(0.3), cd.Cross2Shape(0.4), cd.Cross2Shape(0.5), cd.Cross2Shape(0.6),
    cd.Cross2Shape(0.7), cd.ArrowShape(), cd.ArrowShape(45), cd.ArrowShape(90, 0.5), cd.ArrowShape(
    135, 0.5, 0.2), cd.ArrowShape(180, 0.3, 0.2, 0.3), cd.ArrowShape(225, 1, 0.5, 0.7),
    cd.ArrowShape(270, 1, 0.5, 0.25), cd.ArrowShape(315, 0.5, 0.5, 0), cd.ArrowShape(30, 0.5, 0.1,
    0.6), cd.ArrowShape(210, 0.5, 0.1, 0.6), cd.ArrowShape(330, 0.7, 0.1), cd.ArrowShape(150, 0.7,
    0.1));

// Create a XYChart object of size 500 x 450 pixels
c = cd.XYChart(500, 450);

// Set search path to current directory for loading icon images
c.setSearchPath(GetPageContext());

// Set the plotarea at (55, 40) and of size 400 x 350 pixels, with a light grey border (0xc0c0c0).
// Turn on both horizontal and vertical grid lines with light grey color (0xc0c0c0)
c.setPlotArea(55, 40, 400, 350, -1, -1, "0xc0c0c0", "0xc0c0c0", -1);

// Add a title to the chart using 18pt Times Bold Itatic font.
c.addTitle("Built-in Symbols", "Times New Roman Bold Italic", 18);

// Set the axes line width to 3 pixels
c.xAxis().setWidth(3);
c.yAxis().setWidth(3);

// Ensure the ticks are at least 1 unit part (integer ticks)
c.xAxis().setMinTickInc(1);
c.yAxis().setMinTickInc(1);

// Add each symbol as a separate scatter layer.
for (i = 0; i LT ArrayLen(symbols); i = i + 1) {
    c.addScatterLayer(Array(i Mod 7 + 1.0), Array(Int(i / 7 + 1.0)), "", symbols[i + 1], 17);
}

// Output the chart
chart1URL = c.makeSession(GetPageContext(), "chart1");

// Include tool tip for the chart
imageMap1 = c.getHTMLImageMap("", "", "title='(x, y) = ({x}, {value})'");

</cfscript>
<html>
<body style="margin:5px 0px 0px 5px">
<div style="font-size:18pt; font-family:verdana; font-weight:bold">
    Built-in Symbols
</div>
<hr style="border:solid 1px #000080" />
<cfoutput>
<div style="font-size:9pt; font-family:verdana; margin-bottom:1.5em">
    <a href='viewsource.cfm?file=#CGI.SCRIPT_NAME#'>View Source Code</a>
</div>
<img src="getchart.cfm?#chart1URL#" usemap="##map1" border="0" />
<map name="map1">#imageMap1#</map>
</cfoutput>
</body>
</html> |