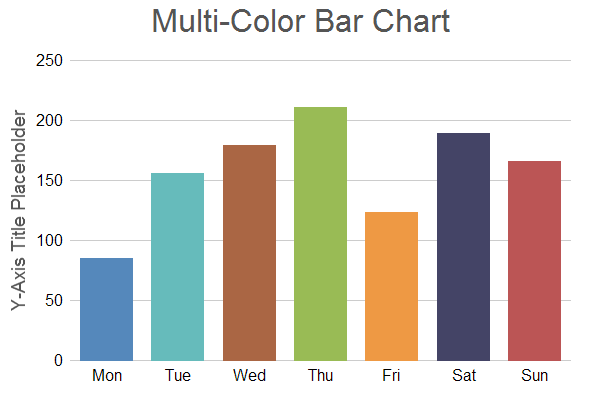
This example is the same as Simple Bar Chart (2), except that XYChart.addBarLayer3 is used to add a multi-color bar layer instead of a regular bar layer.
ChartDirector 6.0 (ColdFusion Edition)
Multi-Color Bar Chart (1)
Source Code Listing
<cfscript>

// ChartDirector for ColdFusion API Access Point
cd = CreateObject("java", "ChartDirector.CFChart");

// A utility to allow us to create arrays with data in one line of code
function Array() {
    var result = ArrayNew(1);
    var i = 0;
    for (i = 1; i LTE ArrayLen(arguments); i = i + 1)
        result[i] = arguments[i];
    return result;
}

// The data for the bar chart
data = Array(85, 156, 179, 211, 123, 189, 166);

// The labels for the bar chart
labels = Array("Mon", "Tue", "Wed", "Thu", "Fri", "Sat", "Sun");

// The colors for the bars
colors = Array("0x5588bb", "0x66bbbb", "0xaa6644", "0x99bb55", "0xee9944", "0x444466", "0xbb5555");

// Create a XYChart object of size 600 x 400 pixels
c = cd.XYChart(600, 400);

// Add a title box using grey (0x555555) 24pt Arial font
c.addTitle("Multi-Color Bar Chart", "Arial", 24, "0x555555");

// Set the plotarea at (70, 60) and of size 500 x 300 pixels, with transparent background and border
// and light grey (0xcccccc) horizontal grid lines
c.setPlotArea(70, 60, 500, 300, cd.Transparent, -1, cd.Transparent, "0xcccccc");

// Set the x and y axis stems to transparent and the label font to 12pt Arial
c.xAxis().setColors(cd.Transparent);
c.yAxis().setColors(cd.Transparent);
c.xAxis().setLabelStyle("Arial", 12);
c.yAxis().setLabelStyle("Arial", 12);

// Add a multi-color bar chart layer with transparent border using the given data
c.addBarLayer3(data, colors).setBorderColor(cd.Transparent);

// Set the labels on the x axis.
c.xAxis().setLabels(labels);

// For the automatic y-axis labels, set the minimum spacing to 40 pixels.
c.yAxis().setTickDensity(40);

// Add a title to the y axis using dark grey (0x555555) 14pt Arial font
c.yAxis().setTitle("Y-Axis Title Placeholder", "Arial", 14, "0x555555");

// Output the chart
chart1URL = c.makeSession(GetPageContext(), "chart1");

// Include tool tip for the chart
imageMap1 = c.getHTMLImageMap("", "", "title='{xLabel}: ${value}M'");

</cfscript>
<html>
<body style="margin:5px 0px 0px 5px">
<div style="font-size:18pt; font-family:verdana; font-weight:bold">
    Multi-Color Bar Chart (1)
</div>
<hr style="border:solid 1px #000080" />
<cfoutput>
<div style="font-size:9pt; font-family:verdana; margin-bottom:1.5em">
    <a href='viewsource.cfm?file=#CGI.SCRIPT_NAME#'>View Source Code</a>
</div>
<img src="getchart.cfm?#chart1URL#" usemap="##map1" border="0" />
<map name="map1">#imageMap1#</map>
</cfoutput>
</body>
</html> |