<cfscript>
// ChartDirector for ColdFusion API Access Point
cd = CreateObject("java", "ChartDirector.CFChart");
// A utility to allow us to create arrays with data in one line of code
function Array() {
var result = ArrayNew(1);
var i = 0;
for (i = 1; i LTE ArrayLen(arguments); i = i + 1)
result[i] = arguments[i];
return result;
}
// Function to create the demo charts
function createChart(chartIndex)
{
// Declare local variables
var value = 0;
var bgColor = 0;
var borderColor = 0;
var barColor = 0;
var m = 0;
var smoothColorScale = 0;
var stepColorScale = 0;
var highLowColorScale = 0;
var highColorScale = 0;
var t = 0;
// The value to display on the meter
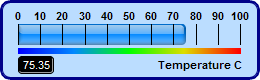
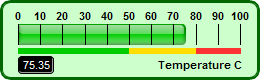
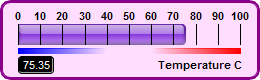
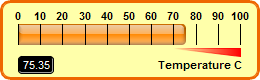
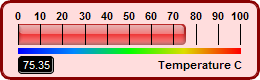
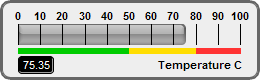
value = 75.35;
// The background, border and bar colors of the meters
bgColor = Array("0xbbddff", "0xccffcc", "0xffddff", "0xffffaa", "0xffdddd", "0xeeeeee");
borderColor = Array("0x000088", "0x006600", "0x880088", "0xee6600", "0x880000", "0x666666");
barColor = Array("0x0088ff", "0x00cc00", "0x8833dd", "0xff8800", "0xee3333", "0x888888");
// Create a LinearMeter object of size 260 x 80 pixels with a 3-pixel thick rounded frame
m = cd.LinearMeter(260, 80, bgColor[chartIndex + 1], borderColor[chartIndex + 1]);
m.setRoundedFrame(cd.Transparent);
m.setThickFrame(3);
// Set the scale region top-left corner at (18, 24), with size of 222 x 20 pixels. The scale
// labels are located on the top (implies horizontal meter)
m.setMeter(18, 24, 222, 20, cd.Top);
// Set meter scale from 0 - 100, with a tick every 10 units
m.setScale(0, 100, 10);
if (chartIndex Mod 4 EQ 0) {
// Add a 5-pixel thick smooth color scale at y = 48 (below the meter scale)
smoothColorScale = Array(0, "0x0000ff", 25, "0x0088ff", 50, "0x00ff00", 75, "0xdddd00", 100,
"0xff0000");
m.addColorScale(smoothColorScale, 48, 5);
} else if (chartIndex Mod 4 EQ 1) {
// Add a 5-pixel thick step color scale at y = 48 (below the meter scale)
stepColorScale = Array(0, "0x00cc00", 50, "0xffdd00", 80, "0xff3333", 100);
m.addColorScale(stepColorScale, 48, 5);
} else if (chartIndex Mod 4 EQ 2) {
// Add a 5-pixel thick high/low color scale at y = 48 (below the meter scale)
highLowColorScale = Array(0, "0x0000ff", 40, cd.Transparent, 60, cd.Transparent, 100,
"0xff0000");
m.addColorScale(highLowColorScale, 48, 5);
} else {
// Add a 5-pixel thick high only color scale at y = 48 (below the meter scale)
highColorScale = Array(70, cd.Transparent, 100, "0xff0000");
m.addColorScale(highColorScale, 48, 0, 48, 8);
}
// Add a bar from 0 to value with glass effect and 4 pixel rounded corners
m.addBar(0, value, barColor[chartIndex + 1], cd.glassEffect(cd.NormalGlare, cd.Top), 4);
// Add a label right aligned to (243, 65) using 8pt Arial Bold font
m.addText(243, 65, "Temperature C", "Arial Bold", 8, cd.TextColor, cd.Right);
// Add a text box left aligned to (18, 65). Display the value using white (0xffffff) 8pt Arial
// Bold font on a black (0x000000) background with depressed rounded border.
t = m.addText(18, 65, m.formatValue(value, "2"), "Arial", 8, "0xffffff", cd.Left);
t.setBackground("0x000000", "0x000000", -1);
t.setRoundedCorners(3);
// Output the chart
return m.makeSession(GetPageContext(), "chart" & chartIndex);
}
chart0URL = createChart(0);
chart1URL = createChart(1);
chart2URL = createChart(2);
chart3URL = createChart(3);
chart4URL = createChart(4);
chart5URL = createChart(5);
</cfscript>
<html>
<body style="margin:5px 0px 0px 5px">
<div style="font-size:18pt; font-family:verdana; font-weight:bold">
Color Horizontal Bar Meters
</div>
<hr style="border:solid 1px #000080" />
<cfoutput>
<div style="font-size:9pt; font-family:verdana; margin-bottom:1.5em">
<a href='viewsource.cfm?file=#CGI.SCRIPT_NAME#'>View Source Code</a>
</div>
<img src="getchart.cfm?#chart0URL#" />
<img src="getchart.cfm?#chart1URL#" />
<img src="getchart.cfm?#chart2URL#" />
<img src="getchart.cfm?#chart3URL#" />
<img src="getchart.cfm?#chart4URL#" />
<img src="getchart.cfm?#chart5URL#" />
</cfoutput>
</body>
</html> |