<cfscript>
// ChartDirector for ColdFusion API Access Point
cd = CreateObject("java", "ChartDirector.CFChart");
// A utility to allow us to create arrays with data in one line of code
function Array() {
var result = ArrayNew(1);
var i = 0;
for (i = 1; i LTE ArrayLen(arguments); i = i + 1)
result[i] = arguments[i];
return result;
}
// Function to create the demo charts
function createChart(chartIndex)
{
// Declare local variables
var value = 0;
var bgColor = 0;
var borderColor = 0;
var m = 0;
var bgGradient = 0;
var smoothColorScale = 0;
var stepColorScale = 0;
var highLowColorScale = 0;
// The value to display on the meter
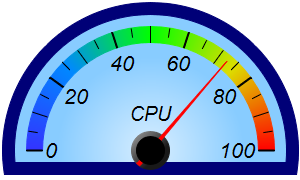
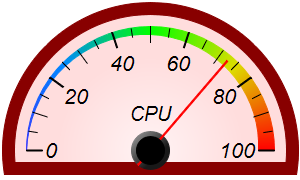
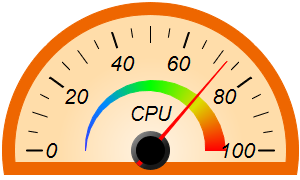
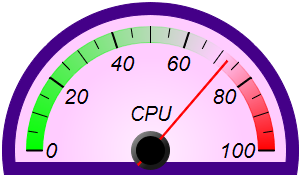
value = 72.55;
// The background and border colors of the meters
bgColor = Array("0x88ccff", "0xffdddd", "0xffddaa", "0xffccff", "0xdddddd", "0xccffcc");
borderColor = Array("0x000077", "0x880000", "0xee6600", "0x440088", "0x000000", "0x006000");
// Create an AngularMeter object of size 300 x 180 pixels with transparent background
m = cd.AngularMeter(300, 180, cd.Transparent);
// Center at (150, 150), scale radius = 124 pixels, scale angle -90 to +90 degrees
m.setMeter(150, 150, 124, -90, 90);
// Background gradient color with brighter color at the center
bgGradient = Array(0, m.adjustBrightness(bgColor[chartIndex + 1], 3), 0.75, bgColor[chartIndex +
1]);
// Add a scale background of 148 pixels radius using the background gradient, with a 13 pixel
// thick border
m.addScaleBackground(148, m.relativeRadialGradient(bgGradient), 13, borderColor[chartIndex + 1])
;
// Meter scale is 0 - 100, with major tick every 20 units, minor tick every 10 units, and micro
// tick every 5 units
m.setScale(0, 100, 20, 10, 5);
// Set the scale label style to 15pt Arial Italic. Set the major/minor/micro tick lengths to
// 16/16/10 pixels pointing inwards, and their widths to 2/1/1 pixels.
m.setLabelStyle("Arial Italic", 16);
m.setTickLength(-16, -16, -10);
m.setLineWidth(0, 2, 1, 1);
// Demostrate different types of color scales and putting them at different positions
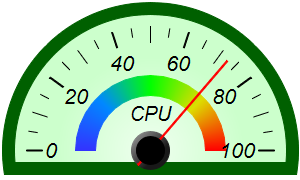
smoothColorScale = Array(0, "0x3333ff", 25, "0x0088ff", 50, "0x00ff00", 75, "0xdddd00", 100,
"0xff0000");
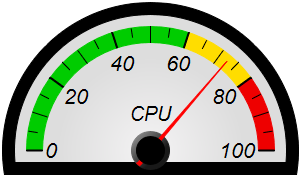
stepColorScale = Array(0, "0x00cc00", 60, "0xffdd00", 80, "0xee0000", 100);
highLowColorScale = Array(0, "0x00ff00", 70, cd.Transparent, 100, "0xff0000");
if (chartIndex EQ 0) {
// Add the smooth color scale at the default position
m.addColorScale(smoothColorScale);
} else if (chartIndex EQ 1) {
// Add the smooth color scale starting at radius 124 with zero width and ending at radius
// 124 with 16 pixels inner width
m.addColorScale(smoothColorScale, 124, 0, 124, -16);
} else if (chartIndex EQ 2) {
// Add the smooth color scale starting at radius 65 with zero width and ending at radius 55
// with 20 pixels outer width
m.addColorScale(smoothColorScale, 65, 0, 55, 20);
} else if (chartIndex EQ 3) {
// Add the high/low color scale at the default position
m.addColorScale(highLowColorScale);
} else if (chartIndex EQ 4) {
// Add the step color scale at the default position
m.addColorScale(stepColorScale);
} else {
// Add the smooth color scale at radius 55 with 20 pixels outer width
m.addColorScale(smoothColorScale, 55, 20);
}
// Add a text label centered at (150, 125) with 15pt Arial Italic font
m.addText(150, 125, "CPU", "Arial Italic", 15, cd.TextColor, cd.BottomCenter);
// Demonstrate two different types of pointers - thin triangular pointer (the default) and line
// pointer
if (chartIndex Mod 2 EQ 0) {
m.addPointer2(value, "0xff0000");
} else {
m.addPointer2(value, "0xff0000", -1, cd.LinePointer2);
}
// Output the chart
return m.makeSession(GetPageContext(), "chart" & chartIndex);
}
chart0URL = createChart(0);
chart1URL = createChart(1);
chart2URL = createChart(2);
chart3URL = createChart(3);
chart4URL = createChart(4);
chart5URL = createChart(5);
</cfscript>
<html>
<body style="margin:5px 0px 0px 5px">
<div style="font-size:18pt; font-family:verdana; font-weight:bold">
Color Semicircle Meters
</div>
<hr style="border:solid 1px #000080" />
<cfoutput>
<div style="font-size:9pt; font-family:verdana; margin-bottom:1.5em">
<a href='viewsource.cfm?file=#CGI.SCRIPT_NAME#'>View Source Code</a>
</div>
<img src="getchart.cfm?#chart0URL#" />
<img src="getchart.cfm?#chart1URL#" />
<img src="getchart.cfm?#chart2URL#" />
<img src="getchart.cfm?#chart3URL#" />
<img src="getchart.cfm?#chart4URL#" />
<img src="getchart.cfm?#chart5URL#" />
</cfoutput>
</body>
</html> |