<cfscript>
// ChartDirector for ColdFusion API Access Point
cd = CreateObject("java", "ChartDirector.CFChart");
// A utility to allow us to create arrays with data in one line of code
function Array() {
var result = ArrayNew(1);
var i = 0;
for (i = 1; i LTE ArrayLen(arguments); i = i + 1)
result[i] = arguments[i];
return result;
}
// Function to create the demo charts
function createChart(chartIndex)
{
// Declare local variables
var dataX = 0;
var dataY = 0;
var r = 0;
var dataZ = 0;
var c = 0;
var layer = 0;
var cAxis = 0;
var colorGradient = 0;
var colorScale = 0;
// The x and y coordinates of the grid
dataX = Array(-4, -3, -2, -1, 0, 1, 2, 3, 4);
dataY = Array(-4, -3, -2, -1, 0, 1, 2, 3, 4);
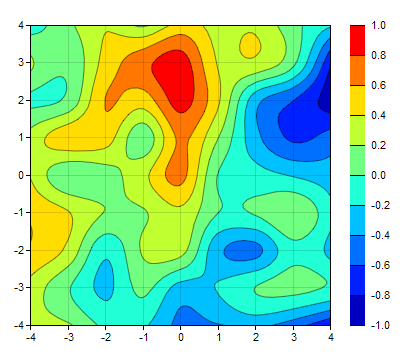
// Use random numbers for the z values on the XY grid
r = cd.RanSeries(99);
dataZ = r.get2DSeries(ArrayLen(dataX), ArrayLen(dataY), -0.9, 0.9);
// Create a XYChart object of size 420 x 360 pixels
c = cd.XYChart(420, 360);
// Set the plotarea at (30, 25) and of size 300 x 300 pixels. Use semi-transparent grey
// (0xdd000000) horizontal and vertical grid lines
c.setPlotArea(30, 25, 300, 300, -1, -1, -1, "0xdd000000", -1);
// Set the x-axis and y-axis scale
c.xAxis().setLinearScale(-4, 4, 1);
c.yAxis().setLinearScale(-4, 4, 1);
// Add a contour layer using the given data
layer = c.addContourLayer(dataX, dataY, dataZ);
// Move the grid lines in front of the contour layer
c.getPlotArea().moveGridBefore(layer);
// Add a color axis (the legend) in which the top left corner is anchored at (350, 25). Set the
// length to 400 300 and the labels on the right side.
cAxis = layer.setColorAxis(350, 25, cd.TopLeft, 300, cd.Right);
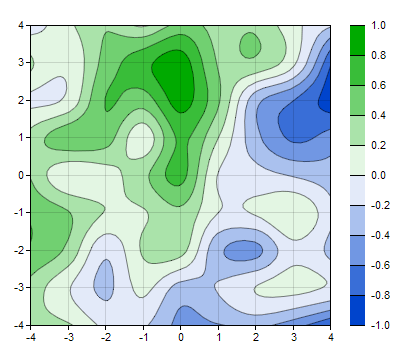
if (chartIndex EQ 1) {
// Speicify a color gradient as a list of colors, and use it in the color axis.
colorGradient = Array("0x0044cc", "0xffffff", "0x00aa00");
cAxis.setColorGradient(False, colorGradient);
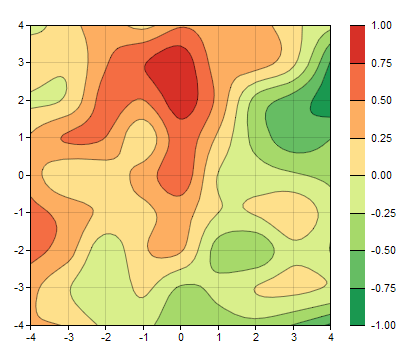
} else if (chartIndex EQ 2) {
// Specify the color scale to use in the color axis
colorScale = Array(-1.0, "0x1a9850", -0.75, "0x66bd63", -0.5, "0xa6d96a", -0.25, "0xd9ef8b",
0, "0xfee08b", 0.25, "0xfdae61", 0.5, "0xf46d43", 0.75, "0xd73027", 1);
cAxis.setColorScale(colorScale);
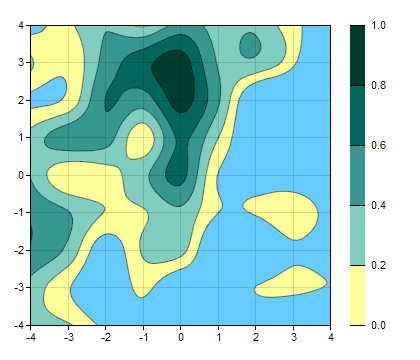
} else if (chartIndex EQ 3) {
// Specify the color scale to use in the color axis. Also specify an underflow color
// 0x66ccff (blue) for regions that fall below the lower axis limit.
colorScale = Array(0, "0xffff99", 0.2, "0x80cdc1", 0.4, "0x35978f", 0.6, "0x01665e", 0.8,
"0x003c30", 1);
cAxis.setColorScale(colorScale, "0x66ccff");
}
// Output the chart
return c.makeSession(GetPageContext(), "chart" & chartIndex);
}
chart0URL = createChart(0);
chart1URL = createChart(1);
chart2URL = createChart(2);
chart3URL = createChart(3);
</cfscript>
<html>
<body style="margin:5px 0px 0px 5px">
<div style="font-size:18pt; font-family:verdana; font-weight:bold">
Contour Color Scale
</div>
<hr style="border:solid 1px #000080" />
<cfoutput>
<div style="font-size:9pt; font-family:verdana; margin-bottom:1.5em">
<a href='viewsource.cfm?file=#CGI.SCRIPT_NAME#'>View Source Code</a>
</div>
<img src="getchart.cfm?#chart0URL#" />
<img src="getchart.cfm?#chart1URL#" />
<img src="getchart.cfm?#chart2URL#" />
<img src="getchart.cfm?#chart3URL#" />
</cfoutput>
</body>
</html> |