<cfscript>
// ChartDirector for ColdFusion API Access Point
cd = CreateObject("java", "ChartDirector.CFChart");
// A utility to allow us to create arrays with data in one line of code
function Array() {
var result = ArrayNew(1);
var i = 0;
for (i = 1; i LTE ArrayLen(arguments); i = i + 1)
result[i] = arguments[i];
return result;
}
// The data for the pie chart
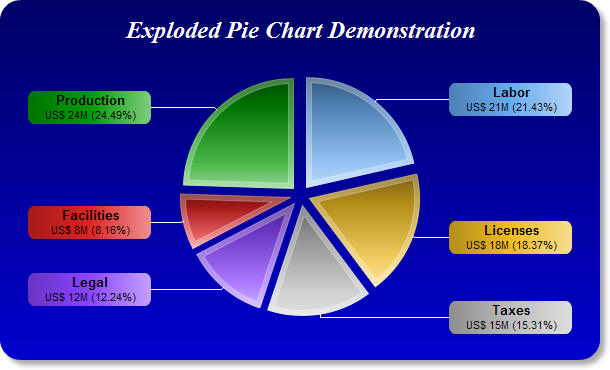
data = Array(21, 18, 15, 12, 8, 24);
// The labels for the pie chart
labels = Array("Labor", "Licenses", "Taxes", "Legal", "Facilities", "Production");
// The colors to use for the sectors
colors = Array("0x66aaee", "0xeebb22", "0xbbbbbb", "0x8844ff", "0xdd2222", "0x009900");
// Create a PieChart object of size 600 x 360 pixels.
c = cd.PieChart(600, 360);
// Use the white on black palette, which means the default text and line colors are white
c.setColors(cd.whiteOnBlackPalette);
// Use a vertical gradient color from deep blue (000066) to blue (0000cc) as background. Use rounded
// corners of 20 pixels radius. Enable soft drop shadow.
c.setBackground(c.linearGradientColor(0, 0, 0, c.getHeight(), "0x000066", "0x0000cc"));
c.setRoundedFrame("0xffffff", 20);
c.setDropShadow();
// Add a title using 18pt Times New Roman Bold Italic font. Add 16 pixels top margin to the title.
c.addTitle("Exploded Pie Chart Demonstration", "Times New Roman Bold Italic", 18).setMargin2(0, 0,
16, 0);
// Set the center of the pie at (300, 195) and the radius to 110 pixels
c.setPieSize(300, 195, 110);
// Set the pie data and the pie labels
c.setData(data, labels);
// Set the sector colors
c.setColors2(cd.DataColor, colors);
// Use local gradient shading for the sectors, with 5 pixels wide semi-transparent white (bbffffff)
// borders
c.setSectorStyle(cd.LocalGradientShading, "0xbbffffff", 5);
// Use the side label layout method
c.setLabelLayout(cd.SideLayout);
// Use 10pt Arial Bold as the default label font. Set the label box background color the same as the
// sector color. Use soft lighting effect with light direction from right. Use 8 pixels rounded
// corners.
t = c.setLabelStyle("Arial Bold", 10, "0x000000");
t.setBackground(cd.SameAsMainColor, cd.Transparent, cd.softLighting(cd.Right, 0));
t.setRoundedCorners(8);
// Set the sector label format. The label is centered in a 110 pixels wide bounding box. It consists
// of two lines. The first line is the sector name. The second line shows the data value and
// percentage.
c.setLabelFormat(
"<*block,halign=center,width=110*>{label}<*br*><*font=Arial,size=8*>US$ {value}M " &
"({percent}%)<*/*>");
// Explode all sectors 10 pixels from the center
c.setExplode(-1, 10);
// Output the chart
chart1URL = c.makeSession(GetPageContext(), "chart1");
// Include tool tip for the chart
imageMap1 = c.getHTMLImageMap("", "", "title='{label}: US${value}M ({percent}%)'");
</cfscript>
<html>
<body style="margin:5px 0px 0px 5px">
<div style="font-size:18pt; font-family:verdana; font-weight:bold">
Exploded Pie Chart
</div>
<hr style="border:solid 1px #000080" />
<cfoutput>
<div style="font-size:9pt; font-family:verdana; margin-bottom:1.5em">
<a href='viewsource.cfm?file=#CGI.SCRIPT_NAME#'>View Source Code</a>
</div>
<img src="getchart.cfm?#chart1URL#" usemap="##map1" border="0" />
<map name="map1">#imageMap1#</map>
</cfoutput>
</body>
</html> |