

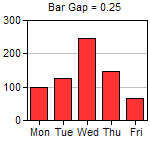

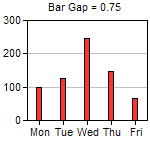
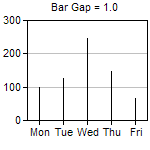
This example demonstrates the effects of different bar gaps configured using BarLayer.setBarGap.
ChartDirector 6.0 (ColdFusion Edition)
Bar Gap
Source Code Listing
<cfscript>

// ChartDirector for ColdFusion API Access Point
cd = CreateObject("java", "ChartDirector.CFChart");

// A utility to allow us to create arrays with data in one line of code
function Array() {
    var result = ArrayNew(1);
    var i = 0;
    for (i = 1; i LTE ArrayLen(arguments); i = i + 1)
        result[i] = arguments[i];
    return result;
}

// Function to create the demo charts
function createChart(chartIndex)
{
    // Declare local variables
    var bargap = 0;
    var data = 0;
    var labels = 0;
    var c = 0;
    var ret = 0;

    bargap = chartIndex * 0.25 - 0.25;

    // The data for the bar chart
    data = Array(100, 125, 245, 147, 67);

    // The labels for the bar chart
    labels = Array("Mon", "Tue", "Wed", "Thu", "Fri");

    // Create a XYChart object of size 150 x 150 pixels
    c = cd.XYChart(150, 150);

    // Set the plotarea at (27, 20) and of size 120 x 100 pixels
    c.setPlotArea(27, 20, 120, 100);

    // Set the labels on the x axis
    c.xAxis().setLabels(labels);

    if (bargap GTE 0) {
        // Add a title to display to bar gap using 8pt Arial font
        c.addTitle("      Bar Gap = " & bargap, "Arial", 8);
    } else {
        // Use negative value to mean TouchBar
        c.addTitle("      Bar Gap = TouchBar", "Arial", 8);
        bargap = cd.TouchBar;
    }

    // Add a bar chart layer using the given data and set the bar gap
    c.addBarLayer(data).setBarGap(bargap);

    // Output the chart
    ret = StructNew();
    ret.imageURL = c.makeSession(GetPageContext(), "chart" & chartIndex);

    // Include tool tip for the chart
    ret.imageMap = c.getHTMLImageMap("", "", "title='Production on {xLabel}: {value} kg'");

    return ret;
}

chart0 = createChart(0);
chart1 = createChart(1);
chart2 = createChart(2);
chart3 = createChart(3);
chart4 = createChart(4);
chart5 = createChart(5);

</cfscript>
<html>
<body style="margin:5px 0px 0px 5px">
<div style="font-size:18pt; font-family:verdana; font-weight:bold">
    Bar Gap
</div>
<hr style="border:solid 1px #000080" />
<cfoutput>
<div style="font-size:9pt; font-family:verdana; margin-bottom:1.5em">
    <a href='viewsource.cfm?file=#CGI.SCRIPT_NAME#'>View Source Code</a>
</div>
<img src="getchart.cfm?#chart0.imageURL#" usemap="##map0" border="0" />
<map name="map0">#chart0.imageMap#</map>
<img src="getchart.cfm?#chart1.imageURL#" usemap="##map1" border="0" />
<map name="map1">#chart1.imageMap#</map>
<img src="getchart.cfm?#chart2.imageURL#" usemap="##map2" border="0" />
<map name="map2">#chart2.imageMap#</map>
<img src="getchart.cfm?#chart3.imageURL#" usemap="##map3" border="0" />
<map name="map3">#chart3.imageMap#</map>
<img src="getchart.cfm?#chart4.imageURL#" usemap="##map4" border="0" />
<map name="map4">#chart4.imageMap#</map>
<img src="getchart.cfm?#chart5.imageURL#" usemap="##map5" border="0" />
<map name="map5">#chart5.imageMap#</map>
</cfoutput>
</body>
</html> |