<cfscript>
// ChartDirector for ColdFusion API Access Point
cd = CreateObject("java", "ChartDirector.CFChart");
// A utility to allow us to create arrays with data in one line of code
function Array() {
var result = ArrayNew(1);
var i = 0;
for (i = 1; i LTE ArrayLen(arguments); i = i + 1)
result[i] = arguments[i];
return result;
}
// The data for the bar chart
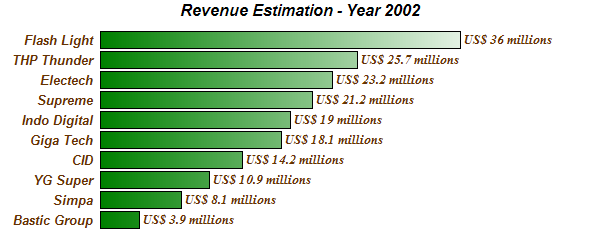
data = Array(3.9, 8.1, 10.9, 14.2, 18.1, 19.0, 21.2, 23.2, 25.7, 36);
// The labels for the bar chart
labels = Array("Bastic Group", "Simpa", "YG Super", "CID", "Giga Tech", "Indo Digital", "Supreme",
"Electech", "THP Thunder", "Flash Light");
// Create a XYChart object of size 600 x 250 pixels
c = cd.XYChart(600, 250);
// Add a title to the chart using Arial Bold Italic font
c.addTitle("Revenue Estimation - Year 2002", "Arial Bold Italic");
// Set the plotarea at (100, 30) and of size 400 x 200 pixels. Set the plotarea border, background
// and grid lines to Transparent
c.setPlotArea(100, 30, 400, 200, cd.Transparent, cd.Transparent, cd.Transparent, cd.Transparent,
cd.Transparent);
// Add a bar chart layer using the given data. Use a gradient color for the bars, where the gradient
// is from dark green (0x008000) to white (0xffffff)
layer = c.addBarLayer(data, c.gradientColor(100, 0, 500, 0, "0x008000", "0xffffff"));
// Swap the axis so that the bars are drawn horizontally
c.swapXY(True);
// Set the bar gap to 10%
layer.setBarGap(0.1);
// Use the format "US$ xxx millions" as the bar label
layer.setAggregateLabelFormat("US$ {value} millions");
// Set the bar label font to 10pt Times Bold Italic/dark red (0x663300)
layer.setAggregateLabelStyle("Times New Roman Bold Italic", 10, "0x663300");
// Set the labels on the x axis
textbox = c.xAxis().setLabels(labels);
// Set the x axis label font to 10pt Arial Bold Italic
textbox.setFontStyle("Arial Bold Italic");
textbox.setFontSize(10);
// Set the x axis to Transparent, with labels in dark red (0x663300)
c.xAxis().setColors(cd.Transparent, "0x663300");
// Set the y axis and labels to Transparent
c.yAxis().setColors(cd.Transparent, cd.Transparent);
// Output the chart
chart1URL = c.makeSession(GetPageContext(), "chart1");
// Include tool tip for the chart
imageMap1 = c.getHTMLImageMap("", "", "title='{xLabel}: US${value} millions'");
</cfscript>
<html>
<body style="margin:5px 0px 0px 5px">
<div style="font-size:18pt; font-family:verdana; font-weight:bold">
Borderless Bar Chart
</div>
<hr style="border:solid 1px #000080" />
<cfoutput>
<div style="font-size:9pt; font-family:verdana; margin-bottom:1.5em">
<a href='viewsource.cfm?file=#CGI.SCRIPT_NAME#'>View Source Code</a>
</div>
<img src="getchart.cfm?#chart1URL#" usemap="##map1" border="0" />
<map name="map1">#imageMap1#</map>
</cfoutput>
</body>
</html> |