<cfscript>
// ChartDirector for ColdFusion API Access Point
cd = CreateObject("java", "ChartDirector.CFChart");
// A utility to allow us to create arrays with data in one line of code
function Array() {
var result = ArrayNew(1);
var i = 0;
for (i = 1; i LTE ArrayLen(arguments); i = i + 1)
result[i] = arguments[i];
return result;
}
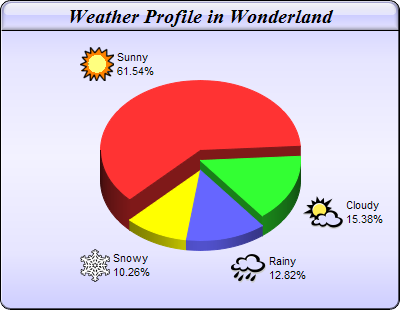
// The data for the pie chart
data = Array(72, 18, 15, 12);
// The depths for the sectors
depths = Array(30, 20, 10, 10);
// The labels for the pie chart
labels = Array("Sunny", "Cloudy", "Rainy", "Snowy");
// The icons for the sectors
icons = Array("sun.png", "cloud.png", "rain.png", "snowy.png");
// Create a PieChart object of size 400 x 310 pixels, with a blue (CCCCFF) vertical metal gradient
// background, black border, 1 pixel 3D border effect and rounded corners
c = cd.PieChart(400, 310, cd.metalColor("0xccccff", 0), "0x000000", 1);
c.setRoundedFrame();
// Set search path to current directory for loading icon images
c.setSearchPath(GetPageContext());
// Set the center of the pie at (200, 180) and the radius to 100 pixels
c.setPieSize(200, 180, 100);
// Add a title box using 15pt Times Bold Italic font, on a blue (CCCCFF) background with glass
// effect
c.addTitle("Weather Profile in Wonderland", "Times New Roman Bold Italic", 15).setBackground(
"0xccccff", "0x000000", cd.glassEffect());
// Set the pie data and the pie labels
c.setData(data, labels);
// Add icons to the chart as a custom field
c.addExtraField(icons);
// Configure the sector labels using CDML to include the icon images
c.setLabelFormat(
"<*block,valign=absmiddle*><*img={field0}*> <*block*>{label}<*br*>{percent}%<*/*><*/*>");
// Draw the pie in 3D with variable 3D depths
c.set3D2(depths);
// Set the start angle to 225 degrees may improve layout when the depths of the sector are sorted in
// descending order, because it ensures the tallest sector is at the back.
c.setStartAngle(225);
// Output the chart
chart1URL = c.makeSession(GetPageContext(), "chart1");
// Include tool tip for the chart
imageMap1 = c.getHTMLImageMap("", "", "title='{label}: {value} days ({percent}%)'");
</cfscript>
<html>
<body style="margin:5px 0px 0px 5px">
<div style="font-size:18pt; font-family:verdana; font-weight:bold">
Icon Pie Chart (1)
</div>
<hr style="border:solid 1px #000080" />
<cfoutput>
<div style="font-size:9pt; font-family:verdana; margin-bottom:1.5em">
<a href='viewsource.cfm?file=#CGI.SCRIPT_NAME#'>View Source Code</a>
</div>
<img src="getchart.cfm?#chart1URL#" usemap="##map1" border="0" />
<map name="map1">#imageMap1#</map>
</cfoutput>
</body>
</html> |