<cfscript>
// ChartDirector for ColdFusion API Access Point
cd = CreateObject("java", "ChartDirector.CFChart");
// A utility to allow us to create arrays with data in one line of code
function Array() {
var result = ArrayNew(1);
var i = 0;
for (i = 1; i LTE ArrayLen(arguments); i = i + 1)
result[i] = arguments[i];
return result;
}
// The data for the chart
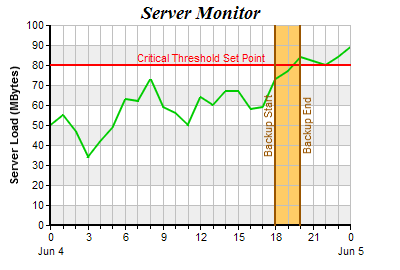
data = Array(50, 55, 47, 34, 42, 49, 63, 62, 73, 59, 56, 50, 64, 60, 67, 67, 58, 59, 73, 77, 84, 82,
80, 84, 89);
// The labels for the chart. Note the "-" means a minor tick.
labels = Array("0<*br*>Jun 4", "1", "2", "3", "4", "5", "6", "7", "8", "9", "10", "11", "12", "13",
"14", "15", "16", "17", "18", "19", "20", "21", "22", "23", "0<*br*>Jun 5");
// Create a XYChart object of size 400 x 270 pixels
c = cd.XYChart(400, 270);
// Set the plotarea at (80, 25) and of size 300 x 200 pixels. Use alternate color background
// (0xeeeeee) and (0xffffff). Set border and grid colors to grey (0xc0c0c0).
c.setPlotArea(50, 25, 300, 200, "0xeeeeee", "0xffffff", "0xc0c0c0", "0xc0c0c0", "0xc0c0c0");
// Add a title to the chart using 14pt Times Bold Italic font
c.addTitle("Server Monitor", "Times New Roman Bold Italic", 14);
// Add a title to the y axis
c.yAxis().setTitle("Server Load (MBytes)");
// Set the y axis width to 2 pixels
c.yAxis().setWidth(2);
// Set the labels on the x axis.
c.xAxis().setLabels(labels);
// Display 1 out of 3 labels on the x-axis. Show minor ticks for remaining labels.
c.xAxis().setLabelStep(3, 1);
// Set the x axis width to 2 pixels
c.xAxis().setWidth(2);
// Add a horizontal red (0x800080) mark line at y = 80
yMark = c.yAxis().addMark(80, "0xff0000", "Critical Threshold Set Point");
// Set the mark line width to 2 pixels
yMark.setLineWidth(2);
// Put the mark label at the top center of the mark line
yMark.setAlignment(cd.TopCenter);
// Add an orange (0xffcc66) zone from x = 18 to x = 20
c.xAxis().addZone(18, 20, "0xffcc66");
// Add a vertical brown (0x995500) mark line at x = 18
xMark1 = c.xAxis().addMark(18, "0x995500", "Backup Start");
// Set the mark line width to 2 pixels
xMark1.setLineWidth(2);
// Put the mark label at the left of the mark line
xMark1.setAlignment(cd.Left);
// Rotate the mark label by 90 degrees so it draws vertically
xMark1.setFontAngle(90);
// Add a vertical brown (0x995500) mark line at x = 20
xMark2 = c.xAxis().addMark(20, "0x995500", "Backup End");
// Set the mark line width to 2 pixels
xMark2.setLineWidth(2);
// Put the mark label at the right of the mark line
xMark2.setAlignment(cd.Right);
// Rotate the mark label by 90 degrees so it draws vertically
xMark2.setFontAngle(90);
// Add a green (0x00cc00) line layer with line width of 2 pixels
c.addLineLayer(data, "0x00cc00").setLineWidth(2);
// Output the chart
chart1URL = c.makeSession(GetPageContext(), "chart1");
// Include tool tip for the chart
imageMap1 = c.getHTMLImageMap("", "", "title='Load at {x}:00 = {value} MBytes'");
</cfscript>
<html>
<body style="margin:5px 0px 0px 5px">
<div style="font-size:18pt; font-family:verdana; font-weight:bold">
Marks and Zones (2)
</div>
<hr style="border:solid 1px #000080" />
<cfoutput>
<div style="font-size:9pt; font-family:verdana; margin-bottom:1.5em">
<a href='viewsource.cfm?file=#CGI.SCRIPT_NAME#'>View Source Code</a>
</div>
<img src="getchart.cfm?#chart1URL#" usemap="##map1" border="0" />
<map name="map1">#imageMap1#</map>
</cfoutput>
</body>
</html> |