<cfscript>
// ChartDirector for ColdFusion API Access Point
cd = CreateObject("java", "ChartDirector.CFChart");
// A utility to allow us to create arrays with data in one line of code
function Array() {
var result = ArrayNew(1);
var i = 0;
for (i = 1; i LTE ArrayLen(arguments); i = i + 1)
result[i] = arguments[i];
return result;
}
// Function to create the demo charts
function createChart(chartIndex)
{
// Declare local variables
var data0 = 0;
var data1 = 0;
var data2 = 0;
var labels = 0;
var c = 0;
var ret = 0;
// The data for the pie chart
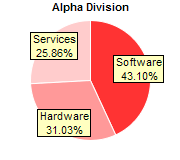
data0 = Array(25, 18, 15);
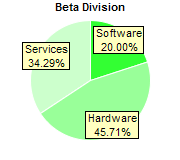
data1 = Array(14, 32, 24);
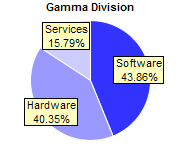
data2 = Array(25, 23, 9);
// The labels for the pie chart
labels = Array("Software", "Hardware", "Services");
// Create a PieChart object of size 180 x 160 pixels
c = cd.PieChart(180, 160);
// Set the center of the pie at (90, 80) and the radius to 60 pixels
c.setPieSize(90, 80, 60);
// Set the border color of the sectors to white (ffffff)
c.setLineColor("0xffffff");
// Set the background color of the sector label to pale yellow (ffffc0) with a black border
// (000000)
c.setLabelStyle().setBackground("0xffffc0", "0x000000");
// Set the label to be slightly inside the perimeter of the circle
c.setLabelLayout(cd.CircleLayout, -10);
// Set the title, data and colors according to which pie to draw
if (chartIndex EQ 0) {
c.addTitle("Alpha Division", "Arial Bold", 8);
c.setData(data0, labels);
c.setColors2(cd.DataColor, Array("0xff3333", "0xff9999", "0xffcccc"));
} else if (chartIndex EQ 1) {
c.addTitle("Beta Division", "Arial Bold", 8);
c.setData(data1, labels);
c.setColors2(cd.DataColor, Array("0x33ff33", "0x99ff99", "0xccffcc"));
} else {
c.addTitle("Gamma Division", "Arial Bold", 8);
c.setData(data2, labels);
c.setColors2(cd.DataColor, Array("0x3333ff", "0x9999ff", "0xccccff"));
}
// Output the chart
ret = StructNew();
ret.imageURL = c.makeSession(GetPageContext(), "chart" & chartIndex);
// Include tool tip for the chart
ret.imageMap = c.getHTMLImageMap("", "", "title='{label}: US${value}M ({percent}%)'");
return ret;
}
chart0 = createChart(0);
chart1 = createChart(1);
chart2 = createChart(2);
</cfscript>
<html>
<body style="margin:5px 0px 0px 5px">
<div style="font-size:18pt; font-family:verdana; font-weight:bold">
Multi-Pie Chart
</div>
<hr style="border:solid 1px #000080" />
<cfoutput>
<div style="font-size:9pt; font-family:verdana; margin-bottom:1.5em">
<a href='viewsource.cfm?file=#CGI.SCRIPT_NAME#'>View Source Code</a>
</div>
<img src="getchart.cfm?#chart0.imageURL#" usemap="##map0" border="0" />
<map name="map0">#chart0.imageMap#</map>
<img src="getchart.cfm?#chart1.imageURL#" usemap="##map1" border="0" />
<map name="map1">#chart1.imageMap#</map>
<img src="getchart.cfm?#chart2.imageURL#" usemap="##map2" border="0" />
<map name="map2">#chart2.imageMap#</map>
</cfoutput>
</body>
</html> |