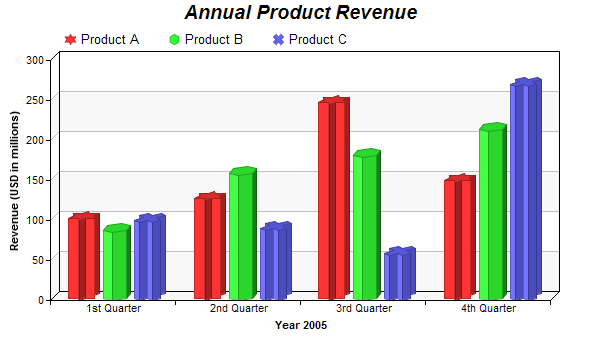
This example demonstrates a multi-bar chart in which each data set has a different bar shape.
The bar shapes are specified using BarLayer.setBarShape. See Shape Specification on how built-in and custom shapes are defined in ChartDirector.
ChartDirector 6.0 (ColdFusion Edition)
Multi-Shape Bar Chart
Source Code Listing
<cfscript>

// ChartDirector for ColdFusion API Access Point
cd = CreateObject("java", "ChartDirector.CFChart");

// A utility to allow us to create arrays with data in one line of code
function Array() {
    var result = ArrayNew(1);
    var i = 0;
    for (i = 1; i LTE ArrayLen(arguments); i = i + 1)
        result[i] = arguments[i];
    return result;
}

// The data for the bar chart
data0 = Array(100, 125, 245, 147);
data1 = Array(85, 156, 179, 211);
data2 = Array(97, 87, 56, 267);
labels = Array("1st Quarter", "2nd Quarter", "3rd Quarter", "4th Quarter");

// Create a XYChart object of size 600 x 350 pixels
c = cd.XYChart(600, 350);

// Add a title to the chart using 14pt Arial Bold Italic font
c.addTitle("Annual Product Revenue", "Arial Bold Italic", 14);

// Set the plot area at (50, 60) and of size 500 x 240. Use two alternative background colors
// (f8f8f8 and ffffff)
c.setPlotArea(50, 60, 500, 240, "0xf8f8f8", "0xffffff");

// Add a legend box at (55, 22) using horizontal layout, with transparent background
c.addLegend(55, 22, False).setBackground(cd.Transparent);

// Set the x axis labels
c.xAxis().setLabels(labels);

// Draw the ticks between label positions (instead of at label positions)
c.xAxis().setTickOffset(0.5);

// Add a multi-bar layer with 3 data sets and 9 pixels 3D depth
layer = c.addBarLayer2(cd.Side, 9);
layer.addDataSet(data0, -1, "Product A");
layer.addDataSet(data1, -1, "Product B");
layer.addDataSet(data2, -1, "Product C");

// Set data set 1 to use a bar shape of a 6-pointed star
layer.setBarShape(cd.StarShape(6), 0);

// Set data set 2 to use a bar shapre of a 6-sided polygon
layer.setBarShape(cd.PolygonShape(6), 1);

// Set data set 3 to use an X bar shape
layer.setBarShape(cd.Cross2Shape(), 2);

// Add a title to the y-axis
c.yAxis().setTitle("Revenue (USD in millions)");

// Add a title to the x axis
c.xAxis().setTitle("Year 2005");

// Output the chart
chart1URL = c.makeSession(GetPageContext(), "chart1");

// Include tool tip for the chart
imageMap1 = c.getHTMLImageMap("", "", "title='{dataSetName}: {xLabel} Revenue = {value} millions'");

</cfscript>
<html>
<body style="margin:5px 0px 0px 5px">
<div style="font-size:18pt; font-family:verdana; font-weight:bold">
    Multi-Shape Bar Chart
</div>
<hr style="border:solid 1px #000080" />
<cfoutput>
<div style="font-size:9pt; font-family:verdana; margin-bottom:1.5em">
    <a href='viewsource.cfm?file=#CGI.SCRIPT_NAME#'>View Source Code</a>
</div>
<img src="getchart.cfm?#chart1URL#" usemap="##map1" border="0" />
<map name="map1">#imageMap1#</map>
</cfoutput>
</body>
</html> |