<cfscript>
// ChartDirector for ColdFusion API Access Point
cd = CreateObject("java", "ChartDirector.CFChart");
// A utility to allow us to create arrays with data in one line of code
function Array() {
var result = ArrayNew(1);
var i = 0;
for (i = 1; i LTE ArrayLen(arguments); i = i + 1)
result[i] = arguments[i];
return result;
}
// Function to create the demo charts
function createChart(chartIndex)
{
// Declare local variables
var value = 0;
var colorList = 0;
var mainColor = 0;
var size = 0;
var outerRadius = 0;
var scaleRadius = 0;
var innerRadius = 0;
var colorScaleWidth = 0;
var tickLength = 0;
var tickWidth = 0;
var fontSize = 0;
var m = 0;
var bgGradient = 0;
var neonGradient = 0;
var smoothColorScale = 0;
var stepColorScale = 0;
var highColorScale = 0;
// The value to display on the meter
value = 50;
// The main color of the four meters in this example. The other colors and gradients are derived
// from the main color.
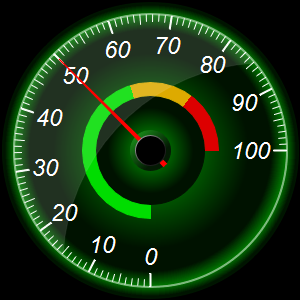
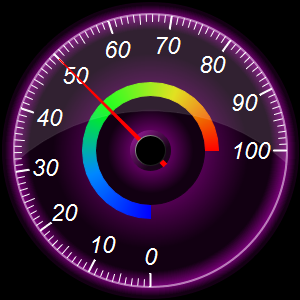
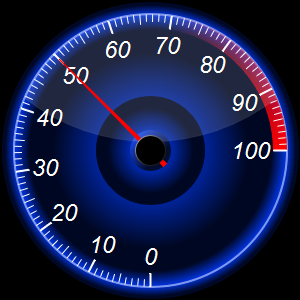
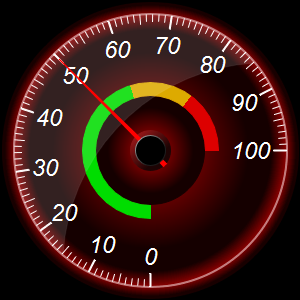
colorList = Array("0x007700", "0x770077", "0x0033dd", "0x880000");
mainColor = colorList[chartIndex + 1];
//
// In this example, we demonstrate how to parameterized by size, so that the chart size can be
// changed by changing just one variable.
//
size = 300;
// The radius of the entire meter, which is size / 2, minus 2 pixels for margin
outerRadius = Fix(size / 2 - 2);
// The radius of the meter scale
scaleRadius = Fix(outerRadius * 92 / 100);
// The radius of the inner decorative circle
innerRadius = Fix(scaleRadius * 40 / 100);
// The width of the color scale
colorScaleWidth = Fix(scaleRadius * 10 / 100);
// Major tick length
tickLength = Fix(scaleRadius * 10 / 100);
// Major tick width
tickWidth = Fix(scaleRadius * 1 / 100 + 1);
// Label font size
fontSize = Fix(scaleRadius * 13 / 100);
//
// Create an angular meter based on the above parameters
//
// Create an AngularMeter object of the specified size. In this demo, we use black (0x000000) as
// the background color. You can also use transparent or other colors.
m = cd.AngularMeter(size, size, "0x000000");
// Set the default text and line colors to white (0xffffff)
m.setColor(cd.TextColor, "0xffffff");
m.setColor(cd.LineColor, "0xffffff");
// Set meter center and scale radius, and set the scale angle from -180 to +90 degrees
m.setMeter(size / 2, size / 2, scaleRadius, -180, 90);
// Background gradient with the mainColor at the center and become darker near the border
bgGradient = Array(0, mainColor, 0.5, m.adjustBrightness(mainColor, 0.75), 1,
m.adjustBrightness(mainColor, 0.15));
// Fill the meter background with the background gradient
m.addRing(0, outerRadius, m.relativeRadialGradient(bgGradient, outerRadius * 0.66));
// Fill the inner circle with the same background gradient for decoration
m.addRing(0, innerRadius, m.relativeRadialGradient(bgGradient, innerRadius * 0.8));
// Gradient for the neon backlight, with the main color at the scale radius fading to
// transparent
neonGradient = Array(0.89, cd.Transparent, 1, mainColor, 1.07, cd.Transparent);
m.addRing(Fix(scaleRadius * 85 / 100), outerRadius, m.relativeRadialGradient(neonGradient));
// The neon ring at the scale radius with width equal to 1/80 of the scale radius, creating
// using a brighter version of the main color
m.addRing(scaleRadius, Fix(scaleRadius + scaleRadius / 80), m.adjustBrightness(mainColor, 2));
// Meter scale is 0 - 100, with major/minor/micro ticks every 10/5/1 units
m.setScale(0, 100, 10, 5, 1);
// Set the scale label style, tick length and tick width. The minor and micro tick lengths are
// 80% and 60% of the major tick length, and their widths are around half of the major tick
// width.
m.setLabelStyle("Arial Italic", fontSize);
m.setTickLength( - tickLength, - Fix(tickLength * 80 / 100), - Fix(tickLength * 60 / 100));
m.setLineWidth(0, tickWidth, Fix((tickWidth + 1) / 2), Fix((tickWidth + 1) / 2));
// Demostrate different types of color scales and glare effects and putting them at different
// positions.
smoothColorScale = Array(0, "0x0000ff", 25, "0x0088ff", 50, "0x00ff00", 75, "0xdddd00", 100,
"0xff0000");
stepColorScale = Array(0, "0x00dd00", 60, "0xddaa00", 80, "0xdd0000", 100);
highColorScale = Array(70, cd.Transparent, 100, "0xff0000");
if (chartIndex EQ 1) {
// Add the smooth color scale just outside the inner circle
m.addColorScale(smoothColorScale, innerRadius + 1, colorScaleWidth);
// Add glare up to the scale radius, concave and spanning 190 degrees
m.addGlare(scaleRadius, -190);
} else if (chartIndex EQ 2) {
// Add the high color scale at the default position
m.addColorScale(highColorScale);
// Add glare up to the scale radius
m.addGlare(scaleRadius);
} else {
// Add the step color scale just outside the inner circle
m.addColorScale(stepColorScale, innerRadius + 1, colorScaleWidth);
// Add glare up to the scale radius, concave and spanning 190 degrees and rotated by -45
// degrees
m.addGlare(scaleRadius, -190, -45);
}
// Add a red (0xff0000) pointer at the specified value
m.addPointer2(value, "0xff0000");
// Set the cap background to a brighter version of the mainColor, and using black (0x000000) for
// the cap and grey (0x999999) for the cap border
m.setCap2(m.adjustBrightness(mainColor, 1.1), "0x000000", "0x999999");
// Output the chart
return m.makeSession(GetPageContext(), "chart" & chartIndex);
}
chart0URL = createChart(0);
chart1URL = createChart(1);
chart2URL = createChart(2);
chart3URL = createChart(3);
</cfscript>
<html>
<body style="margin:5px 0px 0px 5px">
<div style="font-size:18pt; font-family:verdana; font-weight:bold">
Neon Round Meters
</div>
<hr style="border:solid 1px #000080" />
<cfoutput>
<div style="font-size:9pt; font-family:verdana; margin-bottom:1.5em">
<a href='viewsource.cfm?file=#CGI.SCRIPT_NAME#'>View Source Code</a>
</div>
<img src="getchart.cfm?#chart0URL#" />
<img src="getchart.cfm?#chart1URL#" />
<img src="getchart.cfm?#chart2URL#" />
<img src="getchart.cfm?#chart3URL#" />
</cfoutput>
</body>
</html> |