<cfscript>
// ChartDirector for ColdFusion API Access Point
cd = CreateObject("java", "ChartDirector.CFChart");
// A utility to allow us to create arrays with data in one line of code
function Array() {
var result = ArrayNew(1);
var i = 0;
for (i = 1; i LTE ArrayLen(arguments); i = i + 1)
result[i] = arguments[i];
return result;
}
// The data for the area chart
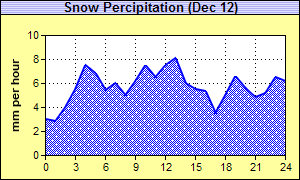
data = Array(3.0, 2.8, 4.0, 5.5, 7.5, 6.8, 5.4, 6.0, 5.0, 6.2, 7.5, 6.5, 7.5, 8.1, 6.0, 5.5, 5.3,
3.5, 5.0, 6.6, 5.6, 4.8, 5.2, 6.5, 6.2);
// The labels for the area chart
labels = Array("0", "1", "2", "3", "4", "5", "6", "7", "8", "9", "10", "11", "12", "13", "14", "15",
"16", "17", "18", "19", "20", "21", "22", "23", "24");
// Create a XYChart object of size 300 x 180 pixels. Set the background to pale yellow (0xffffa0)
// with a black border (0x0)
c = cd.XYChart(300, 180, "0xffffa0", "0x000000");
// Set search path to current directory for loading icon images
c.setSearchPath(GetPageContext());
// Set the plotarea at (45, 35) and of size 240 x 120 pixels. Set the background to white
// (0xffffff). Set both horizontal and vertical grid lines to black (&H0&) dotted lines (pattern
// code 0x0103)
c.setPlotArea(45, 35, 240, 120, "0xffffff", -1, -1, c.dashLineColor("0x000000", "0x000103"),
c.dashLineColor("0x000000", "0x000103"));
// Add a title to the chart using 10pt Arial Bold font. Use a 1 x 2 bitmap pattern as the
// background. Set the border to black (0x0).
c.addTitle("Snow Percipitation (Dec 12)", "Arial Bold", 10).setBackground(c.patternColor(Array(
"0xb0b0f0", "0xe0e0ff"), 2), "0x000000");
// Add a title to the y axis
c.yAxis().setTitle("mm per hour");
// Set the labels on the x axis.
c.xAxis().setLabels(labels);
// Display 1 out of 3 labels on the x-axis.
c.xAxis().setLabelStep(3);
// Add an area layer to the chart
layer = c.addAreaLayer();
// Load a snow pattern from an external file "snow.png".
snowPattern = c.patternColor2("snow.png");
// Add a data set to the area layer using the snow pattern as the fill color. Use deep blue
// (0x0000ff) as the area border line color (&H0000ff&)
layer.addDataSet(data).setDataColor(snowPattern, "0x0000ff");
// Set the line width to 2 pixels to highlight the line
layer.setLineWidth(2);
// Output the chart
chart1URL = c.makeSession(GetPageContext(), "chart1");
// Include tool tip for the chart
imageMap1 = c.getHTMLImageMap("", "", "title='{xLabel}:00 - {value} mm/hour'");
</cfscript>
<html>
<body style="margin:5px 0px 0px 5px">
<div style="font-size:18pt; font-family:verdana; font-weight:bold">
Pattern Area Chart
</div>
<hr style="border:solid 1px #000080" />
<cfoutput>
<div style="font-size:9pt; font-family:verdana; margin-bottom:1.5em">
<a href='viewsource.cfm?file=#CGI.SCRIPT_NAME#'>View Source Code</a>
</div>
<img src="getchart.cfm?#chart1URL#" usemap="##map1" border="0" />
<map name="map1">#imageMap1#</map>
</cfoutput>
</body>
</html> |