<cfscript>
// ChartDirector for ColdFusion API Access Point
cd = CreateObject("java", "ChartDirector.CFChart");
// A utility to allow us to create arrays with data in one line of code
function Array() {
var result = ArrayNew(1);
var i = 0;
for (i = 1; i LTE ArrayLen(arguments); i = i + 1)
result[i] = arguments[i];
return result;
}
// The data for the bar chart
data0 = Array(100, 125, 245, 147, 67);
data1 = Array(85, 156, 179, 211, 123);
data2 = Array(97, 87, 56, 267, 157);
// The labels for the bar chart
labels = Array("Mon", "Tue", "Wed", "Thu", "Fri");
// Create a XYChart object of size 500 x 320 pixels. Use a vertical gradient color from pale blue
// (e8f0f8) to sky blue (aaccff) spanning half the chart height as background. Set border to blue
// (88aaee). Use rounded corners. Enable soft drop shadow.
c = cd.XYChart(500, 320);
c.setBackground(c.linearGradientColor(0, 0, 0, c.getHeight() / 2, "0xe8f0f8", "0xaaccff"),
"0x88aaee");
c.setRoundedFrame();
c.setDropShadow();
// Set search path to current directory for loading icon images
c.setSearchPath(GetPageContext());
// Add a title to the chart using 15 points Arial Italic. Set top/bottom margins to 15 pixels.
title = c.addTitle("Weekly Product Sales", "Arial Italic", 15);
title.setMargin2(0, 0, 15, 15);
// Tentatively set the plotarea to 50 pixels from the left edge, and to just under the title. Set
// the width to 60% of the chart width, and the height to 50 pixels from the bottom edge. Use pale
// blue (e8f0f8) background, transparent border, and grey (aaaaaa) grid lines.
c.setPlotArea(50, title.getHeight(), c.getWidth() * 6 / 10, c.getHeight() - title.getHeight() - 50,
"0xe8f0f8", -1, cd.Transparent, "0xaaaaaa");
// Add a legend box where the top-right corner is anchored at 10 pixels from the right edge, and
// just under the title. Use vertical layout and 8 points Arial font.
legendBox = c.addLegend(c.getWidth() - 10, title.getHeight(), True, "Arial", 8);
legendBox.setAlignment(cd.TopRight);
// Set the legend box background and border to transparent
legendBox.setBackground(cd.Transparent, cd.Transparent);
// Set the legend box icon size to 16 x 32 pixels to match with custom icon size
legendBox.setKeySize(16, 32);
// Set axes to transparent
c.xAxis().setColors(cd.Transparent);
c.yAxis().setColors(cd.Transparent);
// Set the labels on the x axis
c.xAxis().setLabels(labels);
// Add a percentage bar layer
layer = c.addBarLayer2(cd.Percentage);
// Add the three data sets to the bar layer, using icons images with labels as data set names
layer.addDataSet(data0, "0x66aaee", "<*block,valign=absmiddle*><*img=service.png*> Service<*/*>");
layer.addDataSet(data1, "0xeebb22", "<*block,valign=absmiddle*><*img=software.png*> Software<*/*>");
layer.addDataSet(data2, "0xcc88ff", "<*block,valign=absmiddle*><*img=computer.png*> Hardware<*/*>");
// Use soft lighting effect with light direction from top
layer.setBorderColor(cd.Transparent, cd.softLighting(cd.Top));
// Enable data label at the middle of the the bar
layer.setDataLabelStyle().setAlignment(cd.Center);
// For a vertical stacked chart with positive data only, the last data set is always on top.
// However, in a vertical legend box, the last data set is at the bottom. This can be reversed by
// using the setLegend method.
layer.setLegend(cd.ReverseLegend);
// Adjust the plot area size, such that the bounding box (inclusive of axes) is 15 pixels from the
// left edge, just below the title, 10 pixels to the right of the legend box, and 15 pixels from the
// bottom edge.
c.packPlotArea(15, title.getHeight(), c.layoutLegend().getLeftX() - 10, c.getHeight() - 15);
// Output the chart
chart1URL = c.makeSession(GetPageContext(), "chart1");
// Include tool tip for the chart
imageMap1 = c.getHTMLImageMap("", "",
"title='{dataSetName} revenue on {xLabel}: US${value}K ({percent}%)'");
</cfscript>
<html>
<body style="margin:5px 0px 0px 5px">
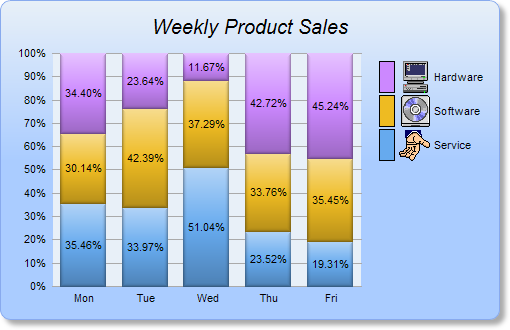
<div style="font-size:18pt; font-family:verdana; font-weight:bold">
Percentage Bar Chart
</div>
<hr style="border:solid 1px #000080" />
<cfoutput>
<div style="font-size:9pt; font-family:verdana; margin-bottom:1.5em">
<a href='viewsource.cfm?file=#CGI.SCRIPT_NAME#'>View Source Code</a>
</div>
<img src="getchart.cfm?#chart1URL#" usemap="##map1" border="0" />
<map name="map1">#imageMap1#</map>
</cfoutput>
</body>
</html> |