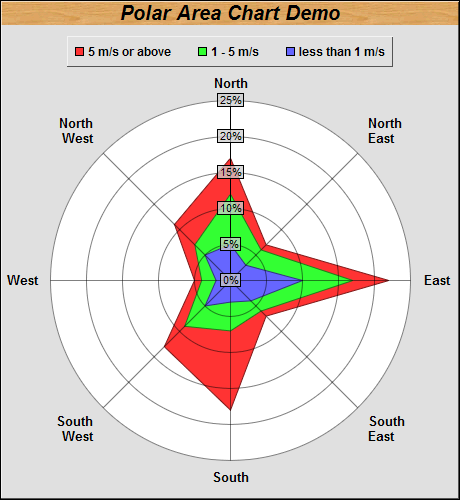
This examples demonstrates a polar area chart.
The polar area layer is created using PolarChart.addAreaLayer. In this example, 3 area layers are used. The area data are already stacked before passing to ChartDirector.
ChartDirector 6.0 (ColdFusion Edition)
Polar Area Chart
Source Code Listing
<cfscript>

// ChartDirector for ColdFusion API Access Point
cd = CreateObject("java", "ChartDirector.CFChart");

// A utility to allow us to create arrays with data in one line of code
function Array() {
    var result = ArrayNew(1);
    var i = 0;
    for (i = 1; i LTE ArrayLen(arguments); i = i + 1)
        result[i] = arguments[i];
    return result;
}

// Data for the chart
data0 = Array(5, 3, 10, 4, 3, 5, 2, 5);
data1 = Array(12, 6, 17, 6, 7, 9, 4, 7);
data2 = Array(17, 7, 22, 7, 18, 13, 5, 11);

labels = Array("North", "North<*br*>East", "East", "South<*br*>East", "South", "South<*br*>West",
    "West", "North<*br*>West");

// Create a PolarChart object of size 460 x 500 pixels, with a grey (e0e0e0) background and 1 pixel
// 3D border
c = cd.PolarChart(460, 500, "0xe0e0e0", "0x000000", 1);

// Set search path to current directory for loading icon images
c.setSearchPath(GetPageContext());

// Add a title to the chart at the top left corner using 15pt Arial Bold Italic font. Use a wood
// pattern as the title background.
c.addTitle("Polar Area Chart Demo", "Arial Bold Italic", 15).setBackground(c.patternColor("wood.png"
    ));

// Set center of plot area at (230, 280) with radius 180 pixels, and white (ffffff) background.
c.setPlotArea(230, 280, 180, "0xffffff");

// Set the grid style to circular grid
c.setGridStyle(False);

// Add a legend box at top-center of plot area (230, 35) using horizontal layout. Use 10pt Arial
// Bold font, with 1 pixel 3D border effect.
b = c.addLegend(230, 35, False, "Arial Bold", 9);
b.setAlignment(cd.TopCenter);
b.setBackground(cd.Transparent, cd.Transparent, 1);

// Set angular axis using the given labels
c.angularAxis().setLabels(labels);

// Specify the label format for the radial axis
c.radialAxis().setLabelFormat("{value}%");

// Set radial axis label background to semi-transparent grey (40cccccc)
c.radialAxis().setLabelStyle().setBackground("0x40cccccc", 0);

// Add the data as area layers
c.addAreaLayer(data2, -1, "5 m/s or above");
c.addAreaLayer(data1, -1, "1 - 5 m/s");
c.addAreaLayer(data0, -1, "less than 1 m/s");

// Output the chart
chart1URL = c.makeSession(GetPageContext(), "chart1");

// Include tool tip for the chart
imageMap1 = c.getHTMLImageMap("", "", "title='[{label}] {dataSetName}: {value}%'");

</cfscript>
<html>
<body style="margin:5px 0px 0px 5px">
<div style="font-size:18pt; font-family:verdana; font-weight:bold">
    Polar Area Chart
</div>
<hr style="border:solid 1px #000080" />
<cfoutput>
<div style="font-size:9pt; font-family:verdana; margin-bottom:1.5em">
    <a href='viewsource.cfm?file=#CGI.SCRIPT_NAME#'>View Source Code</a>
</div>
<img src="getchart.cfm?#chart1URL#" usemap="##map1" border="0" />
<map name="map1">#imageMap1#</map>
</cfoutput>
</body>
</html> |