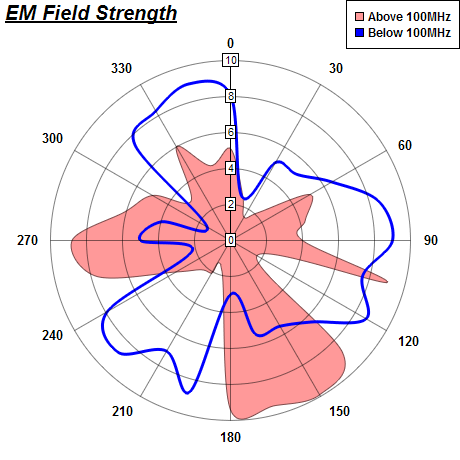
This example demonstrates polar spline line and polar spline area.
The polar spline line is created using PolarChart.addSplineLineLayer. The polar spline area is created using PolarChart.addSplineAreaLayer.
ChartDirector 6.0 (ColdFusion Edition)
Polar Spline Chart
Source Code Listing
<cfscript>

// ChartDirector for ColdFusion API Access Point
cd = CreateObject("java", "ChartDirector.CFChart");

// A utility to allow us to create arrays with data in one line of code
function Array() {
    var result = ArrayNew(1);
    var i = 0;
    for (i = 1; i LTE ArrayLen(arguments); i = i + 1)
        result[i] = arguments[i];
    return result;
}

// The data for the chart
data0 = Array(5.1, 2.6, 1.5, 2.2, 5.1, 4.3, 4.0, 9.0, 1.7, 8.8, 9.9, 9.5, 9.4, 1.8, 2.1, 2.3, 3.5,
    7.7, 8.8, 6.1, 5.0, 3.1, 6.0, 4.3);
angles0 = Array(0, 15, 30, 45, 60, 75, 90, 105, 120, 135, 150, 165, 180, 195, 210, 225, 240, 255,
    270, 285, 300, 315, 330, 345);

data1 = Array(8.1, 2.5, 5, 5.2, 6.5, 8.5, 9, 7.6, 8.7, 6.4, 5.5, 5.4, 3.0, 8.7, 7.1, 8.8, 7.9, 2.2,
    5.0, 4.0, 1.5, 7.5, 8.3, 9.0);
angles1 = Array(0, 15, 30, 45, 60, 75, 90, 105, 120, 135, 150, 165, 180, 195, 210, 225, 240, 255,
    270, 285, 300, 315, 330, 345);

// Create a PolarChart object of size 460 x 460 pixels
c = cd.PolarChart(460, 460);

// Add a title to the chart at the top left corner using 15pt Arial Bold Italic font
c.addTitle2(cd.TopLeft, "<*underline=2*>EM Field Strength", "Arial Bold Italic", 15);

// Set center of plot area at (230, 240) with radius 180 pixels
c.setPlotArea(230, 240, 180);

// Set the grid style to circular grid
c.setGridStyle(False);

// Add a legend box at the top right corner of the chart using 9pt Arial Bold font
c.addLegend(459, 0, True, "Arial Bold", 9).setAlignment(cd.TopRight);

// Set angular axis as 0 - 360, with a spoke every 30 units
c.angularAxis().setLinearScale(0, 360, 30);

// Add a red (0xff9999) spline area layer to the chart using (data0, angles0)
c.addSplineAreaLayer(data0, "0xff9999", "Above 100MHz").setAngles(angles0);

// Add a blue (0xff) spline line layer to the chart using (data1, angle1)
layer1 = c.addSplineLineLayer(data1, "0x0000ff", "Below 100MHz");
layer1.setAngles(angles1);

// Set the line width to 3 pixels
layer1.setLineWidth(3);

// Output the chart
chart1URL = c.makeSession(GetPageContext(), "chart1");

// Include tool tip for the chart
imageMap1 = c.getHTMLImageMap("", "", "title='{dataSetName} EM field at {angle} deg: {value} Watt'")
    ;

</cfscript>
<html>
<body style="margin:5px 0px 0px 5px">
<div style="font-size:18pt; font-family:verdana; font-weight:bold">
    Polar Spline Chart
</div>
<hr style="border:solid 1px #000080" />
<cfoutput>
<div style="font-size:9pt; font-family:verdana; margin-bottom:1.5em">
    <a href='viewsource.cfm?file=#CGI.SCRIPT_NAME#'>View Source Code</a>
</div>
<img src="getchart.cfm?#chart1URL#" usemap="##map1" border="0" />
<map name="map1">#imageMap1#</map>
</cfoutput>
</body>
</html> |