<cfscript>
// ChartDirector for ColdFusion API Access Point
cd = CreateObject("java", "ChartDirector.CFChart");
// A utility to allow us to create arrays with data in one line of code
function Array() {
var result = ArrayNew(1);
var i = 0;
for (i = 1; i LTE ArrayLen(arguments); i = i + 1)
result[i] = arguments[i];
return result;
}
// The data for the bar chart
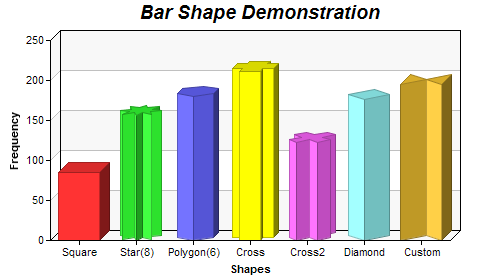
data = Array(85, 156, 179.5, 211, 123, 176, 195);
// The labels for the bar chart
labels = Array("Square", "Star(8)", "Polygon(6)", "Cross", "Cross2", "Diamond", "Custom");
// Create a XYChart object of size 500 x 280 pixels.
c = cd.XYChart(500, 280);
// Set the plotarea at (50, 40) with alternating light grey (f8f8f8) / white (ffffff) background
c.setPlotArea(50, 40, 400, 200, "0xf8f8f8", "0xffffff");
// Add a title to the chart using 14pt Arial Bold Italic font
c.addTitle(" Bar Shape Demonstration", "Arial Bold Italic", 14);
// Add a multi-color bar chart layer
layer = c.addBarLayer3(data);
// Set layer to 3D with 10 pixels 3D depth
layer.set3D(10);
// Set bar shape to circular (cylinder)
layer.setBarShape(cd.CircleShape);
// Set the first bar (index = 0) to square shape
layer.setBarShape(cd.SquareShape, 0, 0);
// Set the second bar to 8-pointed star
layer.setBarShape(cd.StarShape(8), 0, 1);
// Set the third bar to 6-sided polygon
layer.setBarShape(cd.PolygonShape(6), 0, 2);
// Set the next 3 bars to cross shape, X shape and diamond shape
layer.setBarShape(cd.CrossShape(), 0, 3);
layer.setBarShape(cd.Cross2Shape(), 0, 4);
layer.setBarShape(cd.DiamondShape, 0, 5);
// Set the last bar to a custom shape, specified as an array of (x, y) points in normalized
// coordinates
layer.setBarShape2(Array(-500, 0, 0, 500, 500, 0, 500, 1000, 0, 500, -500, 1000), 0, 6);
// Set the labels on the x axis.
c.xAxis().setLabels(labels);
// Add a title to the y axis
c.yAxis().setTitle("Frequency");
// Add a title to the x axis
c.xAxis().setTitle("Shapes");
// Output the chart
chart1URL = c.makeSession(GetPageContext(), "chart1");
// Include tool tip for the chart
imageMap1 = c.getHTMLImageMap("", "", "title='{xLabel}: {value}'");
</cfscript>
<html>
<body style="margin:5px 0px 0px 5px">
<div style="font-size:18pt; font-family:verdana; font-weight:bold">
Polygon Bar Shapes
</div>
<hr style="border:solid 1px #000080" />
<cfoutput>
<div style="font-size:9pt; font-family:verdana; margin-bottom:1.5em">
<a href='viewsource.cfm?file=#CGI.SCRIPT_NAME#'>View Source Code</a>
</div>
<img src="getchart.cfm?#chart1URL#" usemap="##map1" border="0" />
<map name="map1">#imageMap1#</map>
</cfoutput>
</body>
</html> |