<cfscript>
// ChartDirector for ColdFusion API Access Point
cd = CreateObject("java", "ChartDirector.CFChart");
// A utility to allow us to create arrays with data in one line of code
function Array() {
var result = ArrayNew(1);
var i = 0;
for (i = 1; i LTE ArrayLen(arguments); i = i + 1)
result[i] = arguments[i];
return result;
}
// Data for the chart
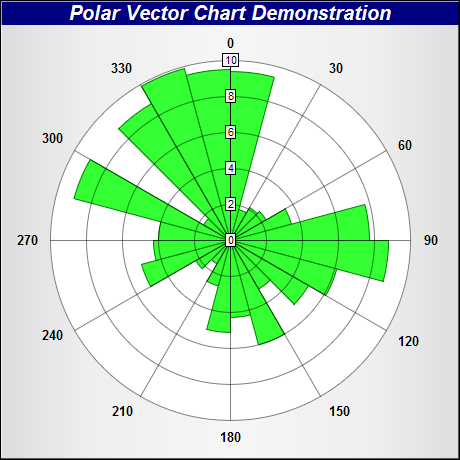
data = Array(9.4, 1.8, 2.1, 2.3, 3.5, 7.7, 8.8, 6.1, 5.0, 3.1, 6.0, 4.3, 5.1, 2.6, 1.5, 2.2, 5.1,
4.3, 4.0, 9.0, 1.7, 8.8, 9.9, 9.5);
angles = Array(0, 15, 30, 45, 60, 75, 90, 105, 120, 135, 150, 165, 180, 195, 210, 225, 240, 255,
270, 285, 300, 315, 330, 345);
// Create a PolarChart object of size 460 x 460 pixels, with a silver background and a 1 pixel 3D
// border
c = cd.PolarChart(460, 460, cd.silverColor(), "0x000000", 1);
// Add a title to the chart at the top left corner using 15pt Arial Bold Italic font. Use white text
// on deep blue background.
c.addTitle("Polar Vector Chart Demonstration", "Arial Bold Italic", 15, "0xffffff").setBackground(
"0x000080");
// Set plot area center at (230, 240) with radius 180 pixels and white background
c.setPlotArea(230, 240, 180, "0xffffff");
// Set the grid style to circular grid
c.setGridStyle(False);
// Set angular axis as 0 - 360, with a spoke every 30 units
c.angularAxis().setLinearScale(0, 360, 30);
// Add sectors to the chart as sector zones
for (i = 0; i LT ArrayLen(data); i = i + 1) {
c.angularAxis().addZone(angles[i + 1], angles[i + 1] + 15, 0, data[i + 1], "0x33ff33",
"0x008000");
}
// Add an Transparent invisible layer to ensure the axis is auto-scaled using the data
c.addLineLayer(data, cd.Transparent);
// Output the chart
chart1URL = c.makeSession(GetPageContext(), "chart1");
</cfscript>
<html>
<body style="margin:5px 0px 0px 5px">
<div style="font-size:18pt; font-family:verdana; font-weight:bold">
Simple Rose Chart
</div>
<hr style="border:solid 1px #000080" />
<cfoutput>
<div style="font-size:9pt; font-family:verdana; margin-bottom:1.5em">
<a href='viewsource.cfm?file=#CGI.SCRIPT_NAME#'>View Source Code</a>
</div>
<img src="getchart.cfm?#chart1URL#" />
</cfoutput>
</body>
</html> |