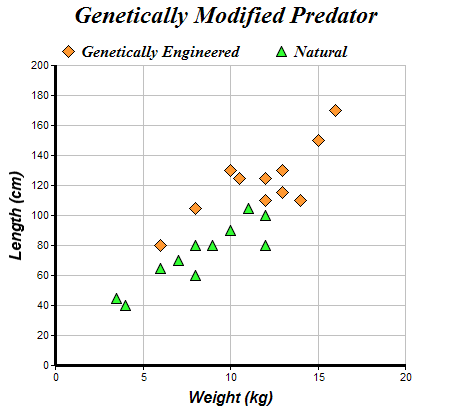
This example demonstrates a scatter chart created using XYChart.addScatterLayer.
ChartDirector 6.0 (ColdFusion Edition)
Scatter Chart
Source Code Listing
<cfscript>

// ChartDirector for ColdFusion API Access Point
cd = CreateObject("java", "ChartDirector.CFChart");

// A utility to allow us to create arrays with data in one line of code
function Array() {
    var result = ArrayNew(1);
    var i = 0;
    for (i = 1; i LTE ArrayLen(arguments); i = i + 1)
        result[i] = arguments[i];
    return result;
}

// The XY points for the scatter chart
dataX0 = Array(10, 15, 6, 12, 14, 8, 13, 13, 16, 12, 10.5);
dataY0 = Array(130, 150, 80, 110, 110, 105, 130, 115, 170, 125, 125);

dataX1 = Array(6, 12, 4, 3.5, 7, 8, 9, 10, 12, 11, 8);
dataY1 = Array(65, 80, 40, 45, 70, 80, 80, 90, 100, 105, 60);

// Create a XYChart object of size 450 x 420 pixels
c = cd.XYChart(450, 420);

// Set the plotarea at (55, 65) and of size 350 x 300 pixels, with a light grey border (0xc0c0c0).
// Turn on both horizontal and vertical grid lines with light grey color (0xc0c0c0)
c.setPlotArea(55, 65, 350, 300, -1, -1, "0xc0c0c0", "0xc0c0c0", -1);

// Add a legend box at (50, 30) (top of the chart) with horizontal layout. Use 12pt Times Bold
// Italic font. Set the background and border color to Transparent.
c.addLegend(50, 30, False, "Times New Roman Bold Italic", 12).setBackground(cd.Transparent);

// Add a title to the chart using 18pt Times Bold Itatic font.
c.addTitle("Genetically Modified Predator", "Times New Roman Bold Italic", 18);

// Add a title to the y axis using 12pt Arial Bold Italic font
c.yAxis().setTitle("Length (cm)", "Arial Bold Italic", 12);

// Add a title to the x axis using 12pt Arial Bold Italic font
c.xAxis().setTitle("Weight (kg)", "Arial Bold Italic", 12);

// Set the axes line width to 3 pixels
c.xAxis().setWidth(3);
c.yAxis().setWidth(3);

// Add an orange (0xff9933) scatter chart layer, using 13 pixel diamonds as symbols
c.addScatterLayer(dataX0, dataY0, "Genetically Engineered", cd.DiamondSymbol, 13, "0xff9933");

// Add a green (0x33ff33) scatter chart layer, using 11 pixel triangles as symbols
c.addScatterLayer(dataX1, dataY1, "Natural", cd.TriangleSymbol, 11, "0x33ff33");

// Output the chart
chart1URL = c.makeSession(GetPageContext(), "chart1");

// Include tool tip for the chart
imageMap1 = c.getHTMLImageMap("", "", "title='[{dataSetName}] Weight = {x} kg, Length = {value} cm'"
    );

</cfscript>
<html>
<body style="margin:5px 0px 0px 5px">
<div style="font-size:18pt; font-family:verdana; font-weight:bold">
    Scatter Chart
</div>
<hr style="border:solid 1px #000080" />
<cfoutput>
<div style="font-size:9pt; font-family:verdana; margin-bottom:1.5em">
    <a href='viewsource.cfm?file=#CGI.SCRIPT_NAME#'>View Source Code</a>
</div>
<img src="getchart.cfm?#chart1URL#" usemap="##map1" border="0" />
<map name="map1">#imageMap1#</map>
</cfoutput>
</body>
</html> |