<cfscript>
// ChartDirector for ColdFusion API Access Point
cd = CreateObject("java", "ChartDirector.CFChart");
// A utility to allow us to create arrays with data in one line of code
function Array() {
var result = ArrayNew(1);
var i = 0;
for (i = 1; i LTE ArrayLen(arguments); i = i + 1)
result[i] = arguments[i];
return result;
}
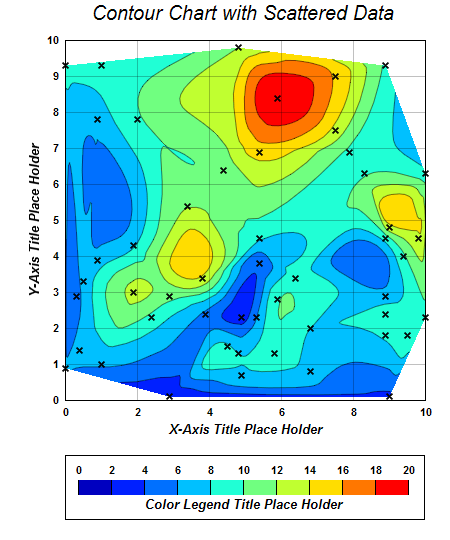
// The (x, y, z) coordinates of the scattered data
dataX = Array(0.5, 1.9, 4.9, 1.0, 8.9, 9.8, 5.9, 2.9, 6.8, 9.0, 0.0, 8.9, 1.9, 4.8, 2.4, 3.4, 7.9,
7.5, 4.8, 7.5, 9.5, 0.4, 8.9, 0.9, 5.4, 9.4, 2.9, 8.9, 0.9, 8.9, 10.0, 1.0, 6.8, 3.8, 9.0, 5.3,
6.4, 4.9, 4.5, 2.0, 5.4, 0.0, 10.0, 3.9, 5.4, 5.9, 5.8, 0.3, 4.4, 8.3);
dataY = Array(3.3, 3.0, 0.7, 1.0, 9.3, 4.5, 8.4, 0.1, 0.8, 0.1, 9.3, 1.8, 4.3, 1.3, 2.3, 5.4, 6.9,
9.0, 9.8, 7.5, 1.8, 1.4, 4.5, 7.8, 3.8, 4.0, 2.9, 2.4, 3.9, 2.9, 2.3, 9.3, 2.0, 3.4, 4.8, 2.3,
3.4, 2.3, 1.5, 7.8, 4.5, 0.9, 6.3, 2.4, 6.9, 2.8, 1.3, 2.9, 6.4, 6.3);
dataZ = Array(6.6, 12.5, 7.4, 6.2, 9.6, 13.6, 19.9, 2.2, 6.9, 3.4, 8.7, 8.4, 7.8, 8.0, 9.4, 11.9,
9.6, 15.7, 12.0, 13.3, 9.6, 6.4, 9.0, 6.9, 4.6, 9.7, 10.6, 9.2, 7.0, 6.9, 9.7, 8.6, 8.0, 13.6,
13.2, 5.9, 9.0, 3.2, 8.3, 9.7, 8.2, 6.1, 8.7, 5.6, 14.9, 9.8, 9.3, 5.1, 10.8, 9.8);
// Create a XYChart object of size 450 x 540 pixels
c = cd.XYChart(450, 540);
// Add a title to the chart using 15 points Arial Italic font
c.addTitle(" Contour Chart with Scattered Data", "Arial Italic", 15);
// Set the plotarea at (65, 40) and of size 360 x 360 pixels. Use semi-transparent black (c0000000)
// for both horizontal and vertical grid lines
c.setPlotArea(65, 40, 360, 360, -1, -1, -1, "0xc0000000", -1);
// Set x-axis and y-axis title using 12 points Arial Bold Italic font
c.xAxis().setTitle("X-Axis Title Place Holder", "Arial Bold Italic", 10);
c.yAxis().setTitle("Y-Axis Title Place Holder", "Arial Bold Italic", 10);
// Set x-axis and y-axis labels to use Arial Bold font
c.xAxis().setLabelStyle("Arial Bold");
c.yAxis().setLabelStyle("Arial Bold");
// When x-axis and y-axis color to transparent
c.xAxis().setColors(cd.Transparent);
c.yAxis().setColors(cd.Transparent);
// Add a scatter layer to the chart to show the position of the data points
c.addScatterLayer(dataX, dataY, "", cd.Cross2Shape(0.2), 7, "0x000000");
// Add a contour layer using the given data
layer = c.addContourLayer(dataX, dataY, dataZ);
// Move the grid lines in front of the contour layer
c.getPlotArea().moveGridBefore(layer);
// Add a color axis (the legend) in which the top center is anchored at (245, 455). Set the length
// to 330 pixels and the labels on the top side.
cAxis = layer.setColorAxis(245, 455, cd.TopCenter, 330, cd.Top);
// Add a bounding box to the color axis using the default line color as border.
cAxis.setBoundingBox(cd.Transparent, cd.LineColor);
// Add a title to the color axis using 12 points Arial Bold Italic font
cAxis.setTitle("Color Legend Title Place Holder", "Arial Bold Italic", 10);
// Set color axis labels to use Arial Bold font
cAxis.setLabelStyle("Arial Bold");
// Set the color axis range as 0 to 20, with a step every 2 units
cAxis.setLinearScale(0, 20, 2);
// Output the chart
chart1URL = c.makeSession(GetPageContext(), "chart1");
</cfscript>
<html>
<body style="margin:5px 0px 0px 5px">
<div style="font-size:18pt; font-family:verdana; font-weight:bold">
Scattered Data Contour Chart
</div>
<hr style="border:solid 1px #000080" />
<cfoutput>
<div style="font-size:9pt; font-family:verdana; margin-bottom:1.5em">
<a href='viewsource.cfm?file=#CGI.SCRIPT_NAME#'>View Source Code</a>
</div>
<img src="getchart.cfm?#chart1URL#" />
</cfoutput>
</body>
</html> |