<cfscript>
// ChartDirector for ColdFusion API Access Point
cd = CreateObject("java", "ChartDirector.CFChart");
// A utility to allow us to create arrays with data in one line of code
function Array() {
var result = ArrayNew(1);
var i = 0;
for (i = 1; i LTE ArrayLen(arguments); i = i + 1)
result[i] = arguments[i];
return result;
}
// The XY points for the scatter chart
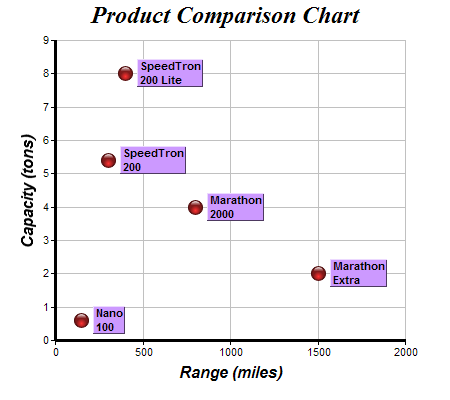
dataX = Array(150, 400, 300, 1500, 800);
dataY = Array(0.6, 8, 5.4, 2, 4);
// The labels for the points
labels = Array("Nano<*br*>100", "SpeedTron<*br*>200 Lite", "SpeedTron<*br*>200",
"Marathon<*br*>Extra", "Marathon<*br*>2000");
// Create a XYChart object of size 450 x 400 pixels
c = cd.XYChart(450, 400);
// Set the plotarea at (55, 40) and of size 350 x 300 pixels, with a light grey border (0xc0c0c0).
// Turn on both horizontal and vertical grid lines with light grey color (0xc0c0c0)
c.setPlotArea(55, 40, 350, 300, "0xffffff", -1, "0xc0c0c0", "0xc0c0c0", -1);
// Add a title to the chart using 18pt Times Bold Itatic font.
c.addTitle("Product Comparison Chart", "Times New Roman Bold Italic", 18);
// Add a title to the y axis using 12pt Arial Bold Italic font
c.yAxis().setTitle("Capacity (tons)", "Arial Bold Italic", 12);
// Add a title to the x axis using 12pt Arial Bold Italic font
c.xAxis().setTitle("Range (miles)", "Arial Bold Italic", 12);
// Set the axes line width to 3 pixels
c.xAxis().setWidth(3);
c.yAxis().setWidth(3);
// Add the data as a scatter chart layer, using a 15 pixel circle as the symbol
layer = c.addScatterLayer(dataX, dataY, "", cd.GlassSphereShape, 15, "0xff3333", "0xff3333");
// Add labels to the chart as an extra field
layer.addExtraField(labels);
// Set the data label format to display the extra field
layer.setDataLabelFormat("{field0}");
// Use 8pt Arial Bold to display the labels
textbox = layer.setDataLabelStyle("Arial Bold", 8);
// Set the background to purple with a 1 pixel 3D border
textbox.setBackground("0xcc99ff", cd.Transparent, 1);
// Put the text box 4 pixels to the right of the data point
textbox.setAlignment(cd.Left);
textbox.setPos(4, 0);
// Output the chart
chart1URL = c.makeSession(GetPageContext(), "chart1");
// Include tool tip for the chart
imageMap1 = c.getHTMLImageMap("", "", "title='Range = {x} miles, Capacity = {value} tons'");
</cfscript>
<html>
<body style="margin:5px 0px 0px 5px">
<div style="font-size:18pt; font-family:verdana; font-weight:bold">
Custom Scatter Labels
</div>
<hr style="border:solid 1px #000080" />
<cfoutput>
<div style="font-size:9pt; font-family:verdana; margin-bottom:1.5em">
<a href='viewsource.cfm?file=#CGI.SCRIPT_NAME#'>View Source Code</a>
</div>
<img src="getchart.cfm?#chart1URL#" usemap="##map1" border="0" />
<map name="map1">#imageMap1#</map>
</cfoutput>
</body>
</html> |