<cfscript>
// ChartDirector for ColdFusion API Access Point
cd = CreateObject("java", "ChartDirector.CFChart");
// A utility to allow us to create arrays with data in one line of code
function Array() {
var result = ArrayNew(1);
var i = 0;
for (i = 1; i LTE ArrayLen(arguments); i = i + 1)
result[i] = arguments[i];
return result;
}
// The XY data of the first data series
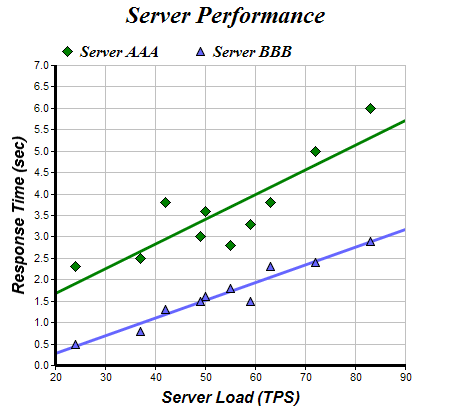
dataX0 = Array(50, 55, 37, 24, 42, 49, 63, 72, 83, 59);
dataY0 = Array(3.6, 2.8, 2.5, 2.3, 3.8, 3.0, 3.8, 5.0, 6.0, 3.3);
// The XY data of the second data series
dataX1 = Array(50, 55, 37, 24, 42, 49, 63, 72, 83, 59);
dataY1 = Array(1.6, 1.8, 0.8, 0.5, 1.3, 1.5, 2.3, 2.4, 2.9, 1.5);
// Tool tip formats for data points and trend lines
scatterToolTip = "title='{dataSetName}: Response time at {x} TPS: {value} sec'";
trendToolTip = "title='Slope = {slope|4} sec/TPS; Intercept = {intercept|4} sec'";
// Create a XYChart object of size 450 x 420 pixels
c = cd.XYChart(450, 420);
// Set the plotarea at (55, 65) and of size 350 x 300 pixels, with white background and a light grey
// border (0xc0c0c0). Turn on both horizontal and vertical grid lines with light grey color
// (0xc0c0c0)
c.setPlotArea(55, 65, 350, 300, "0xffffff", -1, "0xc0c0c0", "0xc0c0c0", -1);
// Add a legend box at (50, 30) (top of the chart) with horizontal layout. Use 12pt Times Bold
// Italic font. Set the background and border color to Transparent.
c.addLegend(50, 30, False, "Times New Roman Bold Italic", 12).setBackground(cd.Transparent);
// Add a title to the chart using 18 point Times Bold Itatic font.
c.addTitle("Server Performance", "Times New Roman Bold Italic", 18);
// Add titles to the axes using 12pt Arial Bold Italic font
c.yAxis().setTitle("Response Time (sec)", "Arial Bold Italic", 12);
c.xAxis().setTitle("Server Load (TPS)", "Arial Bold Italic", 12);
// Set the axes line width to 3 pixels
c.yAxis().setWidth(3);
c.xAxis().setWidth(3);
// Add a scatter layer using (dataX0, dataY0)
scatter1 = c.addScatterLayer(dataX0, dataY0, "Server AAA", cd.DiamondSymbol, 11, "0x008000");
scatter1.setHTMLImageMap("", "", scatterToolTip);
// Add a trend line layer for (dataX0, dataY0)
trend1 = c.addTrendLayer2(dataX0, dataY0, "0x008000");
trend1.setLineWidth(3);
trend1.setHTMLImageMap("", "", trendToolTip);
// Add a scatter layer for (dataX1, dataY1)
scatter2 = c.addScatterLayer(dataX1, dataY1, "Server BBB", cd.TriangleSymbol, 9, "0x6666ff");
scatter2.setHTMLImageMap("", "", scatterToolTip);
// Add a trend line layer for (dataX1, dataY1)
trend2 = c.addTrendLayer2(dataX1, dataY1, "0x6666ff");
trend2.setLineWidth(3);
trend2.setHTMLImageMap("", "", trendToolTip);
// Output the chart
chart1URL = c.makeSession(GetPageContext(), "chart1");
// include tool tip for the chart
imageMap1 = c.getHTMLImageMap("");
</cfscript>
<html>
<body style="margin:5px 0px 0px 5px">
<div style="font-size:18pt; font-family:verdana; font-weight:bold">
Scatter Trend Chart
</div>
<hr style="border:solid 1px #000080" />
<cfoutput>
<div style="font-size:9pt; font-family:verdana; margin-bottom:1.5em">
<a href='viewsource.cfm?file=#CGI.SCRIPT_NAME#'>View Source Code</a>
</div>
<img src="getchart.cfm?#chart1URL#" usemap="##map1" border="0" />
<map name="map1">#imageMap1#</map>
</cfoutput>
</body>
</html> |