<cfscript>
// ChartDirector for ColdFusion API Access Point
cd = CreateObject("java", "ChartDirector.CFChart");
// A utility to allow us to create arrays with data in one line of code
function Array() {
var result = ArrayNew(1);
var i = 0;
for (i = 1; i LTE ArrayLen(arguments); i = i + 1)
result[i] = arguments[i];
return result;
}
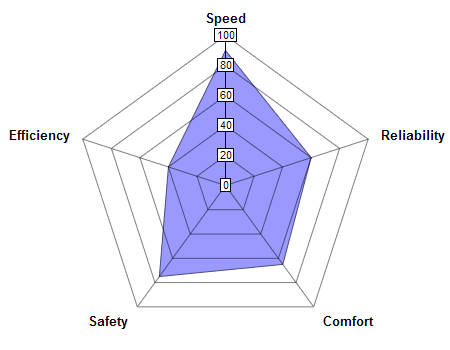
// The data for the chart
data = Array(90, 60, 65, 75, 40);
// The labels for the chart
labels = Array("Speed", "Reliability", "Comfort", "Safety", "Efficiency");
// Create a PolarChart object of size 450 x 350 pixels
c = cd.PolarChart(450, 350);
// Set center of plot area at (225, 185) with radius 150 pixels
c.setPlotArea(225, 185, 150);
// Add an area layer to the polar chart
c.addAreaLayer(data, "0x9999ff");
// Set the labels to the angular axis as spokes
c.angularAxis().setLabels(labels);
// Output the chart
chart1URL = c.makeSession(GetPageContext(), "chart1");
// Include tool tip for the chart
imageMap1 = c.getHTMLImageMap("", "", "title='{label}: score = {value}'");
</cfscript>
<html>
<body style="margin:5px 0px 0px 5px">
<div style="font-size:18pt; font-family:verdana; font-weight:bold">
Simple Radar Chart
</div>
<hr style="border:solid 1px #000080" />
<cfoutput>
<div style="font-size:9pt; font-family:verdana; margin-bottom:1.5em">
<a href='viewsource.cfm?file=#CGI.SCRIPT_NAME#'>View Source Code</a>
</div>
<img src="getchart.cfm?#chart1URL#" usemap="##map1" border="0" />
<map name="map1">#imageMap1#</map>
</cfoutput>
</body>
</html> |