<cfscript>
// ChartDirector for ColdFusion API Access Point
cd = CreateObject("java", "ChartDirector.CFChart");
// A utility to allow us to create arrays with data in one line of code
function Array() {
var result = ArrayNew(1);
var i = 0;
for (i = 1; i LTE ArrayLen(arguments); i = i + 1)
result[i] = arguments[i];
return result;
}
// The x and y coordinates of the grid
dataX = Array(0, 0.1, 0.2, 0.3, 0.4, 0.5, 0.6, 0.7, 0.8, 0.9, 1.0);
dataY = Array(0, 0.1, 0.2, 0.3, 0.4, 0.5, 0.6, 0.7, 0.8, 0.9, 1.0);
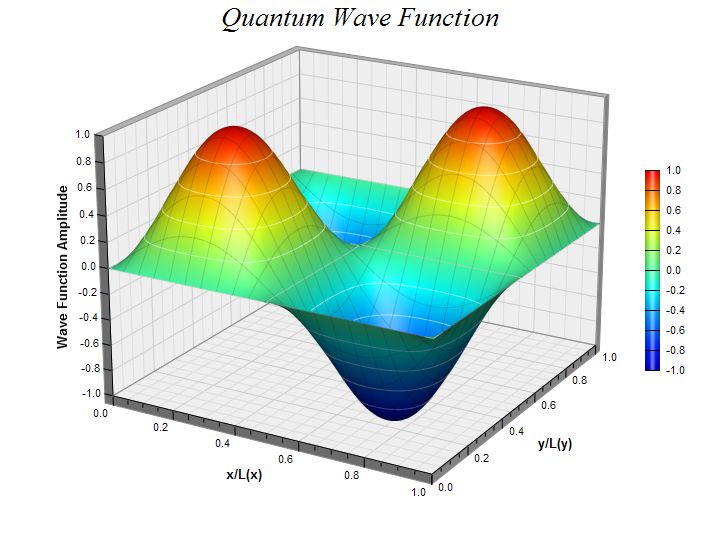
// The values at the grid points. In this example, we will compute the values using the formula z =
// sin((x - 0.5) * 2 * pi) * sin((y - 0.5) * 2 * pi)
dataZ = ArrayNew(1);
for (yIndex = 0; yIndex LT ArrayLen(dataY); yIndex = yIndex + 1) {
y = (dataY[yIndex + 1] - 0.5) * 2 * 3.1416;
for (xIndex = 0; xIndex LT ArrayLen(dataX); xIndex = xIndex + 1) {
x = (dataX[xIndex + 1] - 0.5) * 2 * 3.1416;
dataZ[yIndex * ArrayLen(dataX) + xIndex + 1] = Sin(x) * Sin(y);
}
}
// Create a SurfaceChart object of size 720 x 540 pixels
c = cd.SurfaceChart(720, 540);
// Add a title to the chart using 20 points Times New Roman Italic font
c.addTitle("Quantum Wave Function", "Times New Roman Italic", 20);
// Set the center of the plot region at (360, 245), and set width x depth x height to 360 x 360 x
// 270 pixels
c.setPlotRegion(360, 245, 360, 360, 270);
// Set the elevation and rotation angles to 20 and 30 degrees
c.setViewAngle(20, 30);
// Set the data to use to plot the chart
c.setData(dataX, dataY, dataZ);
// Spline interpolate data to a 80 x 80 grid for a smooth surface
c.setInterpolation(80, 80);
// Set surface grid lines to semi-transparent black (dd000000)
c.setSurfaceAxisGrid("0xdd000000");
// Set contour lines to semi-transparent white (80ffffff)
c.setContourColor("0x80ffffff");
// Add a color axis (the legend) in which the left center is anchored at (645, 270). Set the length
// to 200 pixels and the labels on the right side. Use smooth gradient coloring.
c.setColorAxis(645, 270, cd.Left, 200, cd.Right).setColorGradient();
// Set the x, y and z axis titles using 10 points Arial Bold font
c.xAxis().setTitle("x/L(x)", "Arial Bold", 10);
c.yAxis().setTitle("y/L(y)", "Arial Bold", 10);
c.zAxis().setTitle("Wave Function Amplitude", "Arial Bold", 10);
// Output the chart
chart1URL = c.makeSession(GetPageContext(), "chart1", cd.JPG);
</cfscript>
<html>
<body style="margin:5px 0px 0px 5px">
<div style="font-size:18pt; font-family:verdana; font-weight:bold">
Surface Chart (2)
</div>
<hr style="border:solid 1px #000080" />
<cfoutput>
<div style="font-size:9pt; font-family:verdana; margin-bottom:1.5em">
<a href='viewsource.cfm?file=#CGI.SCRIPT_NAME#'>View Source Code</a>
</div>
<img src="getchart.cfm?#chart1URL#" />
</cfoutput>
</body>
</html> |