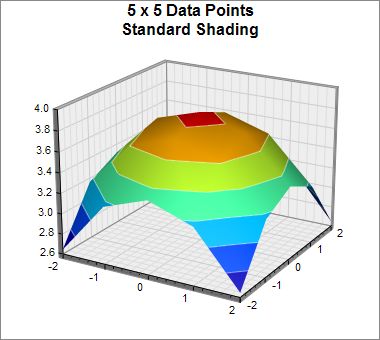
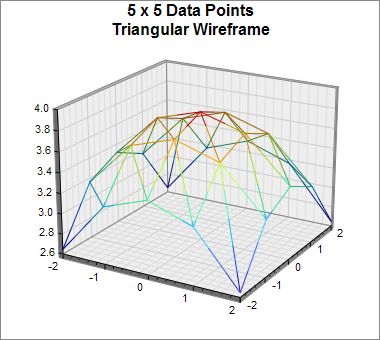
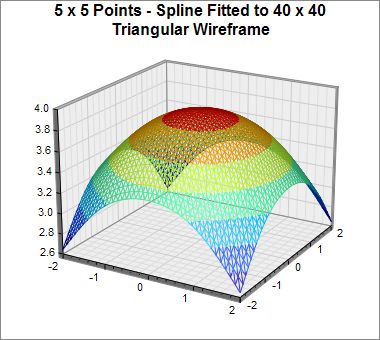
This example demonstrates the rectangular and triangular wireframes of a surface at different interpolation levels, configured using SurfaceChart.setShadingMode and SurfaceChart.setInterpolation.
ChartDirector 6.0 (ColdFusion Edition)
Surface Wireframe
Source Code Listing
<cfscript>
// ChartDirector for ColdFusion API Access Point
cd = CreateObject("java", "ChartDirector.CFChart");
// A utility to allow us to create arrays with data in one line of code
function Array() {
var result = ArrayNew(1);
var i = 0;
for (i = 1; i LTE ArrayLen(arguments); i = i + 1)
result[i] = arguments[i];
return result;
}
// Function to create the demo charts
function createChart(chartIndex)
{
// Declare local variables
var dataX = 0;
var dataY = 0;
var dataZ = 0;
var yIndex = 0;
var y = 0;
var xIndex = 0;
var x = 0;
var c = 0;
// The x and y coordinates of the grid
dataX = Array(-2, -1, 0, 1, 2);
dataY = Array(-2, -1, 0, 1, 2);
// The values at the grid points. In this example, we will compute the values using the formula
// z = square_root(15 - x * x - y * y).
dataZ = ArrayNew(1);
for (yIndex = 0; yIndex LT ArrayLen(dataY); yIndex = yIndex + 1) {
y = dataY[yIndex + 1];
for (xIndex = 0; xIndex LT ArrayLen(dataX); xIndex = xIndex + 1) {
x = dataX[xIndex + 1];
dataZ[yIndex * ArrayLen(dataX) + xIndex + 1] = Sqr(15 - x * x - y * y);
}
}
// Create a SurfaceChart object of size 380 x 340 pixels, with white (ffffff) background and
// grey (888888) border.
c = cd.SurfaceChart(380, 340, "0xffffff", "0x888888");
// Demonstrate various wireframes with and without interpolation
if (chartIndex EQ 0) {
// Original data without interpolation
c.addTitle("5 x 5 Data Points<*br*>Standard Shading", "Arial Bold", 12);
c.setContourColor("0x80ffffff");
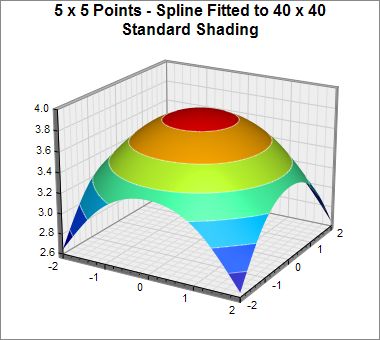
} else if (chartIndex EQ 1) {
// Original data, spline interpolated to 40 x 40 for smoothness
c.addTitle("5 x 5 Points - Spline Fitted to 40 x 40<*br*>Standard Shading", "Arial Bold", 12
);
c.setContourColor("0x80ffffff");
c.setInterpolation(40, 40);
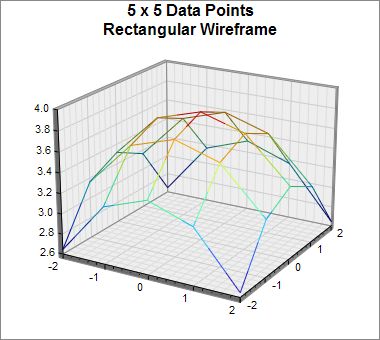
} else if (chartIndex EQ 2) {
// Rectangular wireframe of original data
c.addTitle("5 x 5 Data Points<*br*>Rectangular Wireframe");
c.setShadingMode(cd.RectangularFrame);
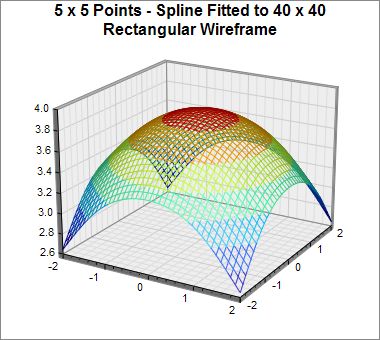
} else if (chartIndex EQ 3) {
// Rectangular wireframe of original data spline interpolated to 40 x 40
c.addTitle("5 x 5 Points - Spline Fitted to 40 x 40<*br*>Rectangular Wireframe");
c.setShadingMode(cd.RectangularFrame);
c.setInterpolation(40, 40);
} else if (chartIndex EQ 4) {
// Triangular wireframe of original data
c.addTitle("5 x 5 Data Points<*br*>Triangular Wireframe");
c.setShadingMode(cd.TriangularFrame);
} else {
// Triangular wireframe of original data spline interpolated to 40 x 40
c.addTitle("5 x 5 Points - Spline Fitted to 40 x 40<*br*>Triangular Wireframe");
c.setShadingMode(cd.TriangularFrame);
c.setInterpolation(40, 40);
}
// Set the center of the plot region at (200, 170), and set width x depth x height to 200 x 200
// x 150 pixels
c.setPlotRegion(200, 170, 200, 200, 150);
// Set the plot region wall thichness to 5 pixels
c.setWallThickness(5);
// Set the elevation and rotation angles to 20 and 30 degrees
c.setViewAngle(20, 30);
// Set the data to use to plot the chart
c.setData(dataX, dataY, dataZ);
// Output the chart
return c.makeSession(GetPageContext(), "chart" & chartIndex, cd.JPG);
}
chart0URL = createChart(0);
chart1URL = createChart(1);
chart2URL = createChart(2);
chart3URL = createChart(3);
chart4URL = createChart(4);
chart5URL = createChart(5);
</cfscript>
<html>
<body style="margin:5px 0px 0px 5px">
<div style="font-size:18pt; font-family:verdana; font-weight:bold">
Surface Wireframe
</div>
<hr style="border:solid 1px #000080" />
<cfoutput>
<div style="font-size:9pt; font-family:verdana; margin-bottom:1.5em">
<a href='viewsource.cfm?file=#CGI.SCRIPT_NAME#'>View Source Code</a>
</div>
<img src="getchart.cfm?#chart0URL#" />
<img src="getchart.cfm?#chart1URL#" />
<img src="getchart.cfm?#chart2URL#" />
<img src="getchart.cfm?#chart3URL#" />
<img src="getchart.cfm?#chart4URL#" />
<img src="getchart.cfm?#chart5URL#" />
</cfoutput>
</body>
</html> |