<cfscript>
// ChartDirector for ColdFusion API Access Point
cd = CreateObject("java", "ChartDirector.CFChart");
// A utility to allow us to create arrays with data in one line of code
function Array() {
var result = ArrayNew(1);
var i = 0;
for (i = 1; i LTE ArrayLen(arguments); i = i + 1)
result[i] = arguments[i];
return result;
}
// The data for the line chart
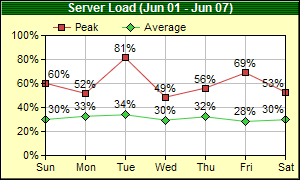
data0 = Array(60.2, 51.7, 81.3, 48.6, 56.2, 68.9, 52.8);
data1 = Array(30.0, 32.7, 33.9, 29.5, 32.2, 28.4, 29.8);
labels = Array("Sun", "Mon", "Tue", "Wed", "Thu", "Fri", "Sat");
// Create a XYChart object of size 300 x 180 pixels, with a pale yellow (0xffffc0) background, a
// black border, and 1 pixel 3D border effect.
c = cd.XYChart(300, 180, "0xffffc0", "0x000000", 1);
// Set the plotarea at (45, 35) and of size 240 x 120 pixels, with white background. Turn on both
// horizontal and vertical grid lines with light grey color (0xc0c0c0)
c.setPlotArea(45, 35, 240, 120, "0xffffff", -1, -1, "0xc0c0c0", -1);
// Add a legend box at (45, 12) (top of the chart) using horizontal layout and 8pt Arial font Set
// the background and border color to Transparent.
c.addLegend(45, 12, False, "", 8).setBackground(cd.Transparent);
// Add a title to the chart using 9pt Arial Bold/white font. Use a 1 x 2 bitmap pattern as the
// background.
c.addTitle("Server Load (Jun 01 - Jun 07)", "Arial Bold", 9, "0xffffff").setBackground(
c.patternColor(Array("0x004000", "0x008000"), 2));
// Set the y axis label format to nn%
c.yAxis().setLabelFormat("{value}%");
// Set the labels on the x axis
c.xAxis().setLabels(labels);
// Add a line layer to the chart
layer = c.addLineLayer();
// Add the first line. Plot the points with a 7 pixel square symbol
layer.addDataSet(data0, "0xcf4040", "Peak").setDataSymbol(cd.SquareSymbol, 7);
// Add the second line. Plot the points with a 9 pixel dismond symbol
layer.addDataSet(data1, "0x40cf40", "Average").setDataSymbol(cd.DiamondSymbol, 9);
// Enable data label on the data points. Set the label format to nn%.
layer.setDataLabelFormat("{value|0}%");
// Output the chart
chart1URL = c.makeSession(GetPageContext(), "chart1");
// Include tool tip for the chart
imageMap1 = c.getHTMLImageMap("", "", "title='{xLabel}: {dataSetName} {value}%'");
</cfscript>
<html>
<body style="margin:5px 0px 0px 5px">
<div style="font-size:18pt; font-family:verdana; font-weight:bold">
Symbol Line Chart
</div>
<hr style="border:solid 1px #000080" />
<cfoutput>
<div style="font-size:9pt; font-family:verdana; margin-bottom:1.5em">
<a href='viewsource.cfm?file=#CGI.SCRIPT_NAME#'>View Source Code</a>
</div>
<img src="getchart.cfm?#chart1URL#" usemap="##map1" border="0" />
<map name="map1">#imageMap1#</map>
</cfoutput>
</body>
</html> |