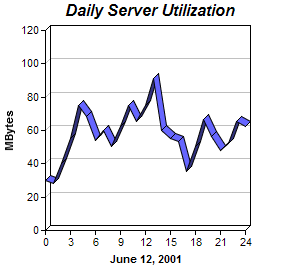
This example demonstrates setting the line to 3D by using Layer.set3D.
ChartDirector 6.0 (ColdFusion Edition)
3D Line Chart
Source Code Listing
<cfscript>

// ChartDirector for ColdFusion API Access Point
cd = CreateObject("java", "ChartDirector.CFChart");

// A utility to allow us to create arrays with data in one line of code
function Array() {
    var result = ArrayNew(1);
    var i = 0;
    for (i = 1; i LTE ArrayLen(arguments); i = i + 1)
        result[i] = arguments[i];
    return result;
}

// The data for the line chart
data = Array(30, 28, 40, 55, 75, 68, 54, 60, 50, 62, 75, 65, 75, 91, 60, 55, 53, 35, 50, 66, 56, 48,
    52, 65, 62);

// The labels for the line chart
labels = Array("0", "1", "2", "3", "4", "5", "6", "7", "8", "9", "10", "11", "12", "13", "14", "15",
    "16", "17", "18", "19", "20", "21", "22", "23", "24");

// Create a XYChart object of size 300 x 280 pixels
c = cd.XYChart(300, 280);

// Set the plotarea at (45, 30) and of size 200 x 200 pixels
c.setPlotArea(45, 30, 200, 200);

// Add a title to the chart using 12pt Arial Bold Italic font
c.addTitle("Daily Server Utilization", "Arial Bold Italic", 12);

// Add a title to the y axis
c.yAxis().setTitle("MBytes");

// Add a title to the x axis
c.xAxis().setTitle("June 12, 2001");

// Add a blue (0x6666ff) 3D line chart layer using the give data
c.addLineLayer(data, "0x6666ff").set3D();

// Set the labels on the x axis.
c.xAxis().setLabels(labels);

// Display 1 out of 3 labels on the x-axis.
c.xAxis().setLabelStep(3);

// Output the chart
chart1URL = c.makeSession(GetPageContext(), "chart1");

// Include tool tip for the chart
imageMap1 = c.getHTMLImageMap("", "", "title='Hour {xLabel}: {value} MBytes'");

</cfscript>
<html>
<body style="margin:5px 0px 0px 5px">
<div style="font-size:18pt; font-family:verdana; font-weight:bold">
    3D Line Chart
</div>
<hr style="border:solid 1px #000080" />
<cfoutput>
<div style="font-size:9pt; font-family:verdana; margin-bottom:1.5em">
    <a href='viewsource.cfm?file=#CGI.SCRIPT_NAME#'>View Source Code</a>
</div>
<img src="getchart.cfm?#chart1URL#" usemap="##map1" border="0" />
<map name="map1">#imageMap1#</map>
</cfoutput>
</body>
</html> |