<cfscript>
// ChartDirector for ColdFusion API Access Point
cd = CreateObject("java", "ChartDirector.CFChart");
// A utility to allow us to create arrays with data in one line of code
function Array() {
var result = ArrayNew(1);
var i = 0;
for (i = 1; i LTE ArrayLen(arguments); i = i + 1)
result[i] = arguments[i];
return result;
}
// The data for the area chart
data0 = Array(42, 49, 33, 38, 51, 46, 29, 41, 44, 57, 59, 52, 37, 34, 51, 56, 56, 60, 70, 76, 63,
67, 75, 64, 51);
data1 = Array(50, 45, 47, 34, 42, 49, 63, 62, 73, 59, 56, 50, 64, 60, 67, 67, 58, 59, 73, 77, 84,
82, 80, 84, 89);
data2 = Array(61, 79, 85, 66, 53, 39, 24, 21, 37, 56, 37, 22, 21, 33, 13, 17, 4, 23, 16, 25, 9, 10,
5, 7, 16);
labels = Array("0", "1", "2", "3", "4", "5", "6", "7", "8", "9", "10", "11", "12", "13", "14", "15",
"16", "17", "18", "19", "20", "21", "22", "23", "24");
// Create a XYChart object of size 500 x 300 pixels
c = cd.XYChart(500, 300);
// Set the plotarea at (90, 30) and of size 300 x 240 pixels.
c.setPlotArea(90, 30, 300, 240);
// Add a legend box at (405, 100)
c.addLegend(405, 100);
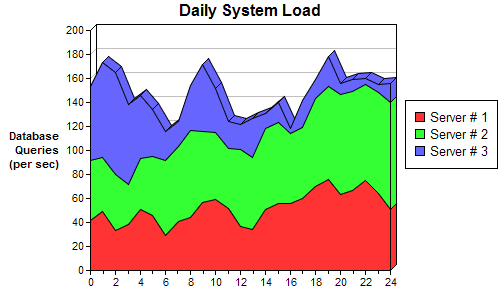
// Add a title to the chart
c.addTitle("Daily System Load");
// Add a title to the y axis. Draw the title upright (font angle = 0)
c.yAxis().setTitle("Database<*br*>Queries<*br*>(per sec)").setFontAngle(0);
// Set the labels on the x axis.
c.xAxis().setLabels(labels);
// Display 1 out of 2 labels on the x-axis. Show minor ticks for remaining labels.
c.xAxis().setLabelStep(2, 1);
// Add an area layer
layer = c.addAreaLayer();
// Draw the area layer in 3D
layer.set3D();
// Add the three data sets to the area layer
layer.addDataSet(data0, -1, "Server ## 1");
layer.addDataSet(data1, -1, "Server ## 2");
layer.addDataSet(data2, -1, "Server ## 3");
// Output the chart
chart1URL = c.makeSession(GetPageContext(), "chart1");
// Include tool tip for the chart
imageMap1 = c.getHTMLImageMap("", "",
"title='{dataSetName} load at hour {xLabel}: {value} queries/sec'");
</cfscript>
<html>
<body style="margin:5px 0px 0px 5px">
<div style="font-size:18pt; font-family:verdana; font-weight:bold">
3D Stacked Area Chart
</div>
<hr style="border:solid 1px #000080" />
<cfoutput>
<div style="font-size:9pt; font-family:verdana; margin-bottom:1.5em">
<a href='viewsource.cfm?file=#CGI.SCRIPT_NAME#'>View Source Code</a>
</div>
<img src="getchart.cfm?#chart1URL#" usemap="##map1" border="0" />
<map name="map1">#imageMap1#</map>
</cfoutput>
</body>
</html> |