<cfscript>
// ChartDirector for ColdFusion API Access Point
cd = CreateObject("java", "ChartDirector.CFChart");
// A utility to allow us to create arrays with data in one line of code
function Array() {
var result = ArrayNew(1);
var i = 0;
for (i = 1; i LTE ArrayLen(arguments); i = i + 1)
result[i] = arguments[i];
return result;
}
// The data for the bar chart
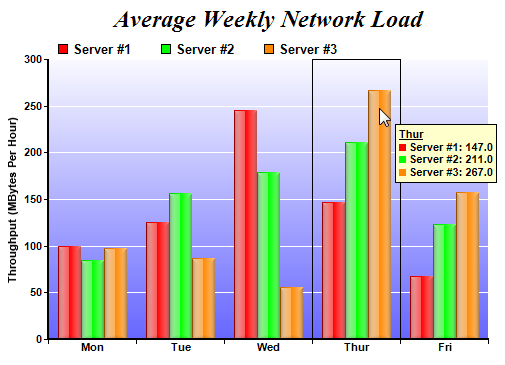
data0 = Array(100, 125, 245, 147, 67);
data1 = Array(85, 156, 179, 211, 123);
data2 = Array(97, 87, 56, 267, 157);
labels = Array("Mon", "Tue", "Wed", "Thur", "Fri");
// Create a XYChart object of size 540 x 375 pixels
c = cd.XYChart(540, 375);
// Add a title to the chart using 18pt Times Bold Italic font
c.addTitle("Average Weekly Network Load", "Times New Roman Bold Italic", 18);
// Set the plotarea at (50, 55) and of 440 x 280 pixels in size. Use a vertical gradient color from
// light blue (f9f9ff) to blue (6666ff) as background. Set border and grid lines to white (ffffff).
c.setPlotArea(50, 55, 440, 280, c.linearGradientColor(0, 55, 0, 335, "0xf9f9ff", "0x6666ff"), -1,
"0xffffff", "0xffffff");
// Add a legend box at (50, 28) using horizontal layout. Use 10pt Arial Bold as font, with
// transparent background.
c.addLegend(50, 28, False, "Arial Bold", 10).setBackground(cd.Transparent);
// Set the x axis labels
c.xAxis().setLabels(labels);
// Draw the ticks between label positions (instead of at label positions)
c.xAxis().setTickOffset(0.5);
// Set axis label style to 8pt Arial Bold
c.xAxis().setLabelStyle("Arial Bold", 8);
c.yAxis().setLabelStyle("Arial Bold", 8);
// Set axis line width to 2 pixels
c.xAxis().setWidth(2);
c.yAxis().setWidth(2);
// Add axis title
c.yAxis().setTitle("Throughput (MBytes Per Hour)");
// Add a multi-bar layer with 3 data sets
layer = c.addBarLayer2(cd.Side);
layer.addDataSet(data0, "0xff0000", "Server ##1");
layer.addDataSet(data1, "0x00ff00", "Server ##2");
layer.addDataSet(data2, "0xff8800", "Server ##3");
// Set bar border to transparent. Use glass lighting effect with light direction from left.
layer.setBorderColor(cd.Transparent, cd.glassEffect(cd.NormalGlare, cd.Left));
// Configure the bars within a group to touch each others (no gap)
layer.setBarGap(0.2, cd.TouchBar);
// Create the WebChartViewer object
viewer = cd.WebChartViewer(GetPageContext(), "chart1");
// Output the chart
chartQuery = c.makeSession(GetPageContext(), viewer.getId());
// Set the chart URL to the viewer
viewer.setImageUrl("getchart.cfm?" & chartQuery);
// Output Javascript chart model to the browser to support tracking cursor
viewer.setChartModel(c.getJsChartModel());
</cfscript>
<!DOCTYPE html>
<html>
<cfoutput>
<head>
<title>Track Box with Floating Legend</title>
<script type="text/javascript" src="cdjcv.js"></script>
</head>
<body style="margin:5px 0px 0px 5px">
<script type="text/javascript">
//
// Use the window load event to set up the MouseMovePlotArea event handler
//
JsChartViewer.addEventListener(window, 'load', function() {
var viewer = JsChartViewer.get('#viewer.getId()#');
// Draw track cursor when mouse is moving over plotarea. Hide it when mouse leaves plot area.
viewer.attachHandler(["MouseMovePlotArea", "TouchStartPlotArea", "TouchMovePlotArea", "ChartMove"],
function(e) {
this.preventDefault(e); // Prevent the browser from using touch events for other actions
trackBoxLegend(viewer, viewer.getPlotAreaMouseX(), viewer.getPlotAreaMouseY());
viewer.setAutoHide("all", ["MouseOutPlotArea", "TouchEndPlotArea"]);
});
});
//
// Draw track box with legend
//
function trackBoxLegend(viewer, mouseX, mouseY)
{
// Remove all previously drawn tracking object
viewer.hideObj("all");
// The chart and its plot area
var c = viewer.getChart();
var plotArea = c.getPlotArea();
// Get the data x-value that is nearest to the mouse
var xValue = c.getNearestXValue(mouseX);
// Compute the position of the box. This example assumes a label based x-axis, in which the labeling spacing
// is one x-axis unit. So the left and right sides of the box is 0.5 unit from the central x-value.
var boxLeft = Math.min(c.getXCoor(xValue - 0.5), c.getXCoor(xValue + 0.5));
var boxWidth = Math.max(0, Math.abs(c.getXCoor(xValue + 0.5) - c.getXCoor(xValue - 0.5)) - 1);
var boxTop = plotArea.getTopY();
var boxHeight = Math.max(0, plotArea.getHeight() - 2);
// Draw the track box
viewer.showTextBox("trackBox", boxLeft, boxTop, JsChartViewer.TopLeft, "",
"width:" + boxWidth + "px;height:" + boxHeight + "px;border:solid 1px black;");
// Array to hold the legend entries
var legendEntries = [];
// Iterate through all layers to build the legend array
for (var i = 0; i < c.getLayerCount(); ++i)
{
var layer = c.getLayerByZ(i);
// The data array index of the x-value
var xIndex = layer.getXIndexOf(xValue);
// Iterate through all the data sets in the layer
for (var j = 0; j < layer.getDataSetCount(); ++j)
{
var dataSet = layer.getDataSetByZ(j);
// Build the legend entry, consist of a colored square box, the name and the data value.
var dataColor = dataSet.getDataColor();
var dataValue = dataSet.getValue(xIndex);
if ((dataValue != null) && (dataColor != null))
{
legendEntries.push("<nobr>" + viewer.htmlRect(7, 7, dataColor) + " " +
dataSet.getDataName() + ": " + dataValue.toPrecision(4) + "</nobr> ");
}
}
}
// Create the legend by joining the legend entries
if (legendEntries.length > 0)
{
var legend = "<u>" + c.xAxis().getFormattedLabel(xValue) + "</u><br />" + legendEntries.reverse().join("<br />");
// Display the legend at the bottom-right side of the mouse cursor
viewer.showTextBox("legend", mouseX + 16, mouseY + 16, JsChartViewer.TopLeft, legend,
"border:solid 1px black;background:##ffffcc;padding:3px;font:bold 11px Arial;-webkit-text-size-adjust:100%;");
}
}
</script>
<div style="font-size:18pt; font-family:verdana; font-weight:bold">
Track Box with Floating Legend
</div>
<hr style="border:solid 1px ##000080" />
<div style="font-size:10pt; font-family:verdana; margin-bottom:1.5em">
<a href="viewsource.cfm?file=#CGI.SCRIPT_NAME#">View Source Code</a>
</div>
<!-- ****** Here is the chart image ****** -->
#viewer.renderHTML(GetPageContext())#
</body>
</cfoutput>
</html> |