<cfscript>
// ChartDirector for ColdFusion API Access Point
cd = CreateObject("java", "ChartDirector.CFChart");
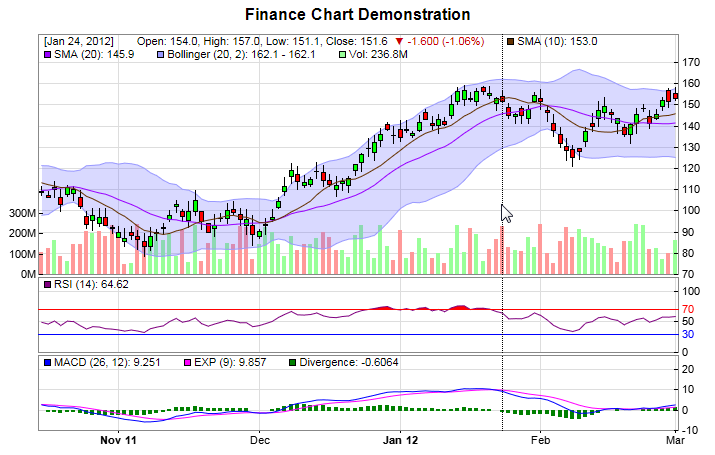
// Create a finance chart demo containing 100 days of data
noOfDays = 100;
// To compute moving averages starting from the first day, we need to get extra data points before
// the first day
extraDays = 30;
// In this exammple, we use a random number generator utility to simulate the data. We set up the
// random table to create 6 cols x (noOfDays + extraDays) rows, using 9 as the seed.
rantable = cd.RanTable(9, 6, noOfDays + extraDays);
// Set the 1st col to be the timeStamp, starting from Sep 4, 2011, with each row representing one
// day, and counting week days only (jump over Sat and Sun)
rantable.setDateCol(0, CreateDate(2011, 9, 4), 86400, True);
// Set the 2nd, 3rd, 4th and 5th columns to be high, low, open and close data. The open value starts
// from 100, and the daily change is random from -5 to 5.
rantable.setHLOCCols(1, 100, -5, 5);
// Set the 6th column as the vol data from 5 to 25 million
rantable.setCol(5, 50000000, 250000000);
// Now we read the data from the table into arrays
timeStamps = rantable.getCol(0);
highData = rantable.getCol(1);
lowData = rantable.getCol(2);
openData = rantable.getCol(3);
closeData = rantable.getCol(4);
volData = rantable.getCol(5);
// Create a FinanceChart object of width 720 pixels
c = cd.FinanceChart(720);
// Add a title to the chart
c.addTitle("Finance Chart Demonstration");
// Disable default legend box, as we are using dynamic legend
c.setLegendStyle("normal", 8, cd.Transparent, cd.Transparent);
// Set the data into the finance chart object
c.setData(timeStamps, highData, lowData, openData, closeData, volData, extraDays);
// Add the main chart with 240 pixels in height
c.addMainChart(240);
// Add a 10 period simple moving average to the main chart, using brown color
c.addSimpleMovingAvg(10, "0x663300");
// Add a 20 period simple moving average to the main chart, using purple color
c.addSimpleMovingAvg(20, "0x9900ff");
// Add candlestick symbols to the main chart, using green/red for up/down days
c.addCandleStick("0x00ff00", "0xff0000");
// Add 20 days bollinger band to the main chart, using light blue (9999ff) as the border and
// semi-transparent blue (c06666ff) as the fill color
c.addBollingerBand(20, 2, "0x9999ff", "0xc06666ff");
// Add a 75 pixels volume bars sub-chart to the bottom of the main chart, using green/red/grey for
// up/down/flat days
c.addVolBars(75, "0x99ff99", "0xff9999", "0x808080");
// Append a 14-days RSI indicator chart (75 pixels high) after the main chart. The main RSI line is
// purple (800080). Set threshold region to +/- 20 (that is, RSI = 50 +/- 25). The upper/lower
// threshold regions will be filled with red (ff0000)/blue (0000ff).
c.addRSI(75, 14, "0x800080", 20, "0xff0000", "0x0000ff");
// Append a MACD(26, 12) indicator chart (75 pixels high) after the main chart, using 9 days for
// computing divergence.
c.addMACD(75, 26, 12, 9, "0x0000ff", "0xff00ff", "0x008000");
// Create the WebChartViewer object
viewer = cd.WebChartViewer(GetPageContext(), "chart1");
// Output the chart
chartQuery = c.makeSession(GetPageContext(), viewer.getId());
// Set the chart URL to the viewer
viewer.setImageUrl("getchart.cfm?" & chartQuery);
// Output Javascript chart model to the browser to support tracking cursor
viewer.setChartModel(c.getJsChartModel());
</cfscript>
<!DOCTYPE html>
<html>
<cfoutput>
<head>
<title>Finance Chart Track Line</title>
<script type="text/javascript" src="cdjcv.js"></script>
</head>
<body style="margin:5px 0px 0px 5px">
<script type="text/javascript">
//
// Use the window load event to set up the MouseMovePlotArea event handler
//
JsChartViewer.addEventListener(window, 'load', function() {
var viewer = JsChartViewer.get('#viewer.getId()#');
// Draw track cursor when mouse is moving over plotarea
viewer.attachHandler(["MouseMovePlotArea", "TouchStartPlotArea", "TouchMovePlotArea", "ChartMove", "Now"],
function(e) {
this.preventDefault(e); // Prevent the browser from using touch events for other actions
traceFinance(viewer, viewer.getPlotAreaMouseX());
});
});
//
// Draw finance chart track line with legend
//
function traceFinance(viewer, mouseX)
{
// Remove all previously drawn tracking object
viewer.hideObj("all");
// It is possible for a FinanceChart to be empty, so we need to check for it.
if (!viewer.getChart())
return;
// Get the data x-value that is nearest to the mouse
var xValue = viewer.getChart().getNearestXValue(mouseX);
// Iterate the XY charts (main price chart and indicator charts) in the FinanceChart
var c = null;
for (var i = 0; i < viewer.getChartCount(); ++i)
{
c = viewer.getChart(i);
// Variables to hold the legend entries
var ohlcLegend = "";
var legendEntries = [];
// Iterate through all layers to build the legend array
for (var j = 0; j < c.getLayerCount(); ++j)
{
var layer = c.getLayerByZ(j);
var xIndex = layer.getXIndexOf(xValue);
var dataSetCount = layer.getDataSetCount();
// In a FinanceChart, only layers showing OHLC data can have 4 data sets
if (dataSetCount == 4)
{
var highValue = layer.getDataSet(0).getValue(xIndex);
var lowValue = layer.getDataSet(1).getValue(xIndex);
var openValue = layer.getDataSet(2).getValue(xIndex);
var closeValue = layer.getDataSet(3).getValue(xIndex);
if (closeValue == null)
continue;
// Build the OHLC legend
ohlcLegend =
"Open: " + openValue.toPrecision(4) + ", High: " + highValue.toPrecision(4) +
", Low: " + lowValue.toPrecision(4) + ", Close: " + closeValue.toPrecision(4);
// We also draw an upward or downward triangle for up and down days and the % change
var lastCloseValue = layer.getDataSet(3).getValue(xIndex - 1);
if (lastCloseValue != null)
{
var change = closeValue - lastCloseValue;
var percent = change * 100 / closeValue;
if (change >= 0)
ohlcLegend += " <span style='color:##008800;'>&##9650; ";
else
ohlcLegend += " <span style='color:##CC0000;'>&##9660; ";
ohlcLegend += change.toPrecision(4) + " (" + percent.toFixed(2) + "%)</span>";
}
// Add a spacer box, and make sure the line does not wrap within the legend entry
ohlcLegend = "<nobr>" + ohlcLegend + viewer.htmlRect(20, 0) + "</nobr> ";
}
else
{
// Iterate through all the data sets in the layer
for (var k = 0; k < dataSetCount; ++k)
{
var dataSet = layer.getDataSetByZ(k);
var name = dataSet.getDataName();
var value = dataSet.getValue(xIndex);
if ((!name) || (value == null))
continue;
// In a FinanceChart, the data set name consists of the indicator name and its latest value. It is
// like "Vol: 123M" or "RSI (14): 55.34". As we are generating the values dynamically, we need to
// extract the indictor name out, and also the volume unit (if any).
// The unit character, if any, is the last character and must not be a digit.
var unitChar = name.charAt(name.length - 1);
if ((unitChar >= '0') && (unitChar <= '9'))
unitChar = '';
// The indicator name is the part of the name up to the colon character.
var delimiterPosition = name.indexOf(':');
if (delimiterPosition != -1)
name = name.substring(0, delimiterPosition);
// In a FinanceChart, if there are two data sets, it must be representing a range.
if (dataSetCount == 2)
{
// We show both values in the range
var value2 = layer.getDataSetByZ(1 - k).getValue(xIndex);
name = name + ": " + Math.min(value, value2).toPrecision(4) + " - "
+ Math.max(value, value2).toPrecision(4);
}
else
{
// In a FinanceChart, only the layer for volume bars has 3 data sets for up/down/flat days
if (dataSetCount == 3)
{
// The actual volume is the sum of the 3 data sets.
value = layer.getDataSet(0).getValue(xIndex) + layer.getDataSet(1).getValue(xIndex) +
layer.getDataSet(2).getValue(xIndex);
}
// Create the legend entry
name = name + ": " + value.toPrecision(4) + unitChar;
}
// Build the legend entry, consist of a colored square box and the name (with the data value in it).
legendEntries.push("<nobr>" + viewer.htmlRect(5, 5, dataSet.getDataColor(),
"solid 1px black") + " " + name + viewer.htmlRect(20, 0) + "</nobr>");
}
}
}
// The legend is formed by concatenating the legend entries.
var legend = legendEntries.reverse().join(" ");
// Add the date and the ohlcLegend (if any) at the beginning of the legend
legend = "<nobr>[" + c.xAxis().getFormattedLabel(xValue, "mmm dd, yyyy") + "]" + viewer.htmlRect(20, 0) +
"</nobr> " + ohlcLegend + legend;
// Get the plot area position relative to the entire FinanceChart
var plotArea = c.getPlotArea();
var plotAreaLeftX = plotArea.getLeftX() + c.getAbsOffsetX();
var plotAreaTopY = plotArea.getTopY() + c.getAbsOffsetY();
// Draw a vertical track line at the x-position
viewer.drawVLine("trackLine" + i, c.getXCoor(xValue) + c.getAbsOffsetX(), plotAreaTopY,
plotAreaTopY + plotArea.getHeight(), "black 1px dotted");
// Display the legend on the top of the plot area
viewer.showTextBox("legend" + i, plotAreaLeftX + 1, plotAreaTopY + 1, JsChartViewer.TopLeft, legend,
"padding-left:5px;width:" + (plotArea.getWidth() - 1) + "px;font:11px Arial;-webkit-text-size-adjust:100%;");
}
}
</script>
<div style="font-size:18pt; font-family:verdana; font-weight:bold">
Finance Chart Track Line
</div>
<hr style="border:solid 1px ##000080" />
<div style="font-size:10pt; font-family:verdana; margin-bottom:1.5em">
<a href="viewsource.cfm?file=#CGI.SCRIPT_NAME#">View Source Code</a>
</div>
<!-- ****** Here is the chart image ****** -->
#viewer.renderHTML(GetPageContext())#
</body>
</cfoutput>
</html> |