<cfscript>
// ChartDirector for ColdFusion API Access Point
cd = CreateObject("java", "ChartDirector.CFChart");
// A utility to allow us to create arrays with data in one line of code
function Array() {
var result = ArrayNew(1);
var i = 0;
for (i = 1; i LTE ArrayLen(arguments); i = i + 1)
result[i] = arguments[i];
return result;
}
// In this example, we simply use random data for the 2 data series.
r = cd.RanSeries(127);
data0 = r.getSeries(180, 70, -5, 5);
data1 = r.getSeries(180, 150, -15, 15);
timeStamps = r.getDateSeries(180, CreateDate(2014, 3, 1), 86400);
// Create a XYChart object of size 640 x 420 pixels
c = cd.XYChart(640, 420);
// Add a title to the chart using 20pt Arial font
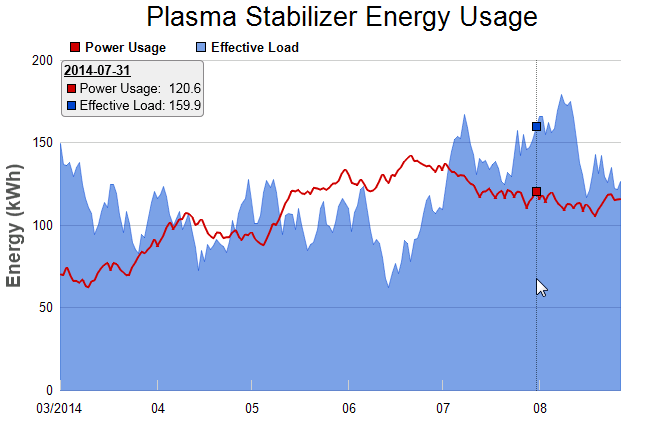
c.addTitle(" Plasma Stabilizer Energy Usage", "Arial", 20);
// Set the plotarea at (55, 60) and of size 560 x 330 pixels, with transparent background and border
// and light grey (0xcccccc) horizontal grid lines
c.setPlotArea(55, 60, 560, 330, -1, -1, cd.Transparent, "0xcccccc");
// Add a legend box at (55, 30) using horizontal layout, with 10pt Arial Bold as font and
// transparent background and border.
c.addLegend(55, 30, False, "Arial Bold", 10).setBackground(cd.Transparent);
// Set axis label style to 10pt Arial
c.xAxis().setLabelStyle("Arial", 10);
c.yAxis().setLabelStyle("Arial", 10);
// Set the x and y axis stems to transparent, and the x-axis tick color to grey (0xcccccc)
c.xAxis().setColors(cd.Transparent, cd.TextColor, cd.TextColor, "0xcccccc");
c.yAxis().setColors(cd.Transparent);
// Configure the x-axis tick lengtht to 10 pixels internal to the plot area
c.xAxis().setTickLength(-10, 0);
// With the ticks internal to the plot area, the x-axis labels will come very close to the axis
// stem, so we configure a wider gap.
c.xAxis().setLabelGap(10);
// For the automatic axis labels, set the minimum spacing to 80/40 pixels for the x/y axis.
c.xAxis().setTickDensity(80);
c.yAxis().setTickDensity(40);
// Use "mm/yyyy" as the x-axis label format for the first plotted month of a year, and "mm" for
// other months
c.xAxis().setMultiFormat(cd.StartOfYearFilter(), "{value|mm/yyyy} ", cd.StartOfMonthFilter(),
"{value|mm}");
// Add a title to the y axis using dark grey (0x555555) 12pt Arial Bold font
c.yAxis().setTitle("Energy (kWh)", "Arial Bold", 14, "0x555555");
// Add a line layer with 2-pixel line width
layer0 = c.addLineLayer(data0, "0xcc0000", "Power Usage");
layer0.setXData(timeStamps);
layer0.setLineWidth(2);
// Add an area layer using semi-transparent blue (0x7f0044cc) as the fill color
layer1 = c.addAreaLayer(data1, "0x7f0044cc", "Effective Load");
layer1.setXData(timeStamps);
layer1.setBorderColor(cd.SameAsMainColor);
// Create the WebChartViewer object
viewer = cd.WebChartViewer(GetPageContext(), "chart1");
// Output the chart
chartQuery = c.makeSession(GetPageContext(), viewer.getId());
// Set the chart URL to the viewer
viewer.setImageUrl("getchart.cfm?" & chartQuery);
// Output Javascript chart model to the browser to support tracking cursor
viewer.setChartModel(c.getJsChartModel());
</cfscript>
<!DOCTYPE html>
<html>
<cfoutput>
<head>
<title>Track Line with Vertical Legend</title>
<script type="text/javascript" src="cdjcv.js"></script>
<style>
.legend {border:solid 1px ##888888; black;background:##eeeeee; font:13px Arial; padding:2px;
border-radius:4px; white-space:nowrap;-webkit-text-size-adjust:100%;}
.legend_caption {text-decoration:underline; font-weight:bold; padding-bottom:2px;}
.legend_table {border-spacing:0px;}
.legend_table td {padding:1px 0px 1px 3px;}
.legend_slide {-webkit-transition:left 0.3s;}
</style>
</head>
<body style="margin:5px 0px 0px 5px">
<script type="text/javascript">
//
// Use the window load event to set up the MouseMovePlotArea event handler
//
JsChartViewer.addEventListener(window, 'load', function() {
var viewer = JsChartViewer.get('#viewer.getId()#');
// Draw track cursor when mouse is moving over plotarea. Hide it when mouse leaves plot area.
viewer.attachHandler(["MouseMovePlotArea", "TouchStartPlotArea", "TouchMovePlotArea", "ChartMove"],
function(e) {
this.preventDefault(e); // Prevent the browser from using touch events for other actions
trackVLegend(viewer, viewer.getPlotAreaMouseX());
viewer.setAutoHide("all", ["MouseOutPlotArea", "TouchEndPlotArea"]);
});
});
//
// Draw track line with axis labels
//
function trackVLegend(viewer, mouseX)
{
// Remember whether we are displaying the legend initially or updating the display.
var legendIsVisible = viewer.isVisible("legend");
// Remove all previously drawn tracking object
viewer.hideObj("all");
// The chart and its plot area
var c = viewer.getChart();
var plotArea = c.getPlotArea();
// Get the data x-value that is nearest to the mouse, and find its pixel coordinate.
var xValue = c.getNearestXValue(mouseX);
var xCoor = c.getXCoor(xValue);
// Draw a vertical track line at the x-position
viewer.drawVLine("trackLine", xCoor, plotArea.getTopY(), plotArea.getBottomY(), "black 1px dotted");
// Array to hold the legend entries
var legendEntries = [];
// Iterate through all layers to draw the axis labels for the data points
for (var i = 0; i < c.getLayerCount(); ++i)
{
var layer = c.getLayerByZ(i);
// The data array index of the x-value
var xIndex = layer.getXIndexOf(xValue);
// Iterate through all the data sets in the layer
for (var j = 0; j < layer.getDataSetCount(); ++j)
{
var dataSet = layer.getDataSetByZ(j);
// Only visible data sets with names are included in the legend.
var dataName = dataSet.getDataName();
var color = dataSet.getDataColor();
var dataValue = dataSet.getValue(xIndex);
if ((!dataName) || (color == null) || (dataValue == null))
continue;
// Build the legend entry, consist of a colored square box, the name and the data value.
legendEntries.push("<tr><td>" + viewer.htmlRect(7, 7, color, "black 1px solid") + " " +
dataSet.getDataName() + ":</td><td>" + dataValue.toPrecision(4) + "</td></tr>");
// Draw a track dot for data points within the plot area
var yCoor = c.getYCoor(dataSet.getPosition(xIndex));
if ((yCoor != null) && (yCoor >= plotArea.getTopY()) && (yCoor <= plotArea.getBottomY()))
{
viewer.showTextBox("dataPoint" + i + "_" + j, xCoor, yCoor, JsChartViewer.Center,
viewer.htmlRect(7, 7, color, "black 1px solid"));
}
}
}
if (legendEntries.length > 0)
{
// Create the legend by joining the legend entries
var legend = "<div class='legend_caption'>" + c.xAxis().getFormattedLabel(xValue, "yyyy-mm-dd")
+ "</div><table class='legend_table'>" + legendEntries.reverse().join("") + "</table>";
// Put the legend box at the opposite side of the mouse
var mouseOnRight = xCoor >= (plotArea.getLeftX() + plotArea.getRightX()) / 2;
var legendX = mouseOnRight ? (plotArea.getLeftX() + 1) : (plotArea.getRightX() - 1);
var alignment = mouseOnRight ? JsChartViewer.TopLeft : JsChartViewer.TopRight;
var legendStyle = "class:legend" + (legendIsVisible ? " legend_slide" : "") + ";";
var legendBox = viewer.showClickableTextBox("legend", legendX, plotArea.getTopY(),
alignment, legend, legendStyle);
}
}
</script>
<div style="font-size:18pt; font-family:verdana; font-weight:bold">
Track Line with Vertical Legend
</div>
<hr style="border:solid 1px ##000080" />
<div style="font-size:10pt; font-family:verdana; margin-bottom:1.5em">
<a href="viewsource.cfm?file=#CGI.SCRIPT_NAME#">View Source Code</a>
</div>
<!-- ****** Here is the chart image ****** -->
#viewer.renderHTML(GetPageContext())#
</body>
</cfoutput>
</html> |