<cfscript>
// ChartDirector for ColdFusion API Access Point
cd = CreateObject("java", "ChartDirector.CFChart");
// A utility to allow us to create arrays with data in one line of code
function Array() {
var result = ArrayNew(1);
var i = 0;
for (i = 1; i LTE ArrayLen(arguments); i = i + 1)
result[i] = arguments[i];
return result;
}
// Function to create the demo charts
function createChart(chartIndex)
{
// Declare local variables
var value = 0;
var m = 0;
var smoothColorScale = 0;
// The value to display on the meter
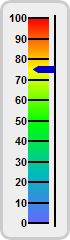
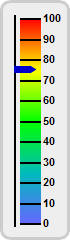
value = 75.35;
// Create a LinearMeter object of size 70 x 240 pixels with very light grey (0xeeeeee)
// backgruond and a light grey (0xccccccc) 3-pixel thick rounded frame
m = cd.LinearMeter(70, 240, "0xeeeeee", "0xcccccc");
m.setRoundedFrame(cd.Transparent);
m.setThickFrame(3);
// This example demonstrates putting the text labels at the left or right side by setting the
// label alignment and scale position.
if (chartIndex EQ 0) {
m.setMeter(28, 18, 20, 205, cd.Left);
} else {
m.setMeter(20, 18, 20, 205, cd.Right);
}
// Set meter scale from 0 - 100, with a tick every 10 units
m.setScale(0, 100, 10);
// Add a smooth color scale to the meter
smoothColorScale = Array(0, "0x6666ff", 25, "0x00bbbb", 50, "0x00ff00", 75, "0xffff00", 100,
"0xff0000");
m.addColorScale(smoothColorScale);
// Add a blue (0x0000cc) pointer at the specified value
m.addPointer(value, "0x0000cc");
// Output the chart
return m.makeSession(GetPageContext(), "chart" & chartIndex);
}
chart0URL = createChart(0);
chart1URL = createChart(1);
</cfscript>
<html>
<body style="margin:5px 0px 0px 5px">
<div style="font-size:18pt; font-family:verdana; font-weight:bold">
V-Linear Meter Orientation
</div>
<hr style="border:solid 1px #000080" />
<cfoutput>
<div style="font-size:9pt; font-family:verdana; margin-bottom:1.5em">
<a href='viewsource.cfm?file=#CGI.SCRIPT_NAME#'>View Source Code</a>
</div>
<img src="getchart.cfm?#chart0URL#" />
<img src="getchart.cfm?#chart1URL#" />
</cfoutput>
</body>
</html> |