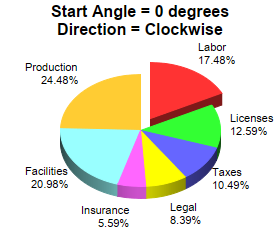
This example demonstrates different sector layout angles and directions.
By default, ChartDirector positions sectors starting from the upward pointing position, and in clockwise direction.
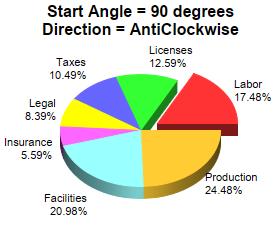
The start angle and layout direction can be changed using
PieChart.setStartAngle.
One common application for
PieChart.setStartAngle is to facilitate layout of pie charts containing many small sectors. Please refer to
Side Label Layout for an example.
[Web Version (in ASP)] aspdemo\anglepie.asp
<%@ language="vbscript" %>
<%
Set cd = CreateObject("ChartDirector.API")

' This script can draw different charts depending on the chartIndex
Sub createChart(viewer, chartIndex)

    ' The data for the pie chart
    data = Array(25, 18, 15, 12, 8, 30, 35)

    ' The labels for the pie chart
    labels = Array("Labor", "Licenses", "Taxes", "Legal", "Insurance", "Facilities", "Production")

    ' Create a PieChart object of size 280 x 240 pixels
    Set c = cd.PieChart(280, 240)

    ' Set the center of the pie at (140, 130) and the radius to 80 pixels
    Call c.setPieSize(140, 130, 80)

    ' Add a title to the pie to show the start angle and direction
    If chartIndex = 0 Then
        Call c.addTitle("Start Angle = 0 degrees<*br*>Direction = Clockwise")
    Else
        Call c.addTitle("Start Angle = 90 degrees<*br*>Direction = AntiClockwise")
        Call c.setStartAngle(90, False)
    End If

    ' Draw the pie in 3D
    Call c.set3D()

    ' Set the pie data and the pie labels
    Call c.setData(data, labels)

    ' Explode the 1st sector (index = 0)
    Call c.setExplode(0)

    ' Output the chart
    Call viewer.setChart(c, cd.SVG)

    ' Include tool tip for the chart
    viewer.ImageMap = c.getHTMLImageMap("", "", "title='{label}: US${value}K ({percent}%)'")
End Sub

' This example includes 2 charts
Dim viewers(1)
For i = 0 To Ubound(viewers)
    Set viewers(i) = cd.WebChartViewer(Request, "chart" & i)
    Call createChart(viewers(i), i)
Next
%>

<!DOCTYPE html>
<html>
<head>
    <title>Start Angle and Direction</title>
    <!-- Include ChartDirector Javascript Library to support chart interactions -->
    <script type="text/javascript" src="cdjcv.js"></script>
</head>
<body style="margin:5px 0px 0px 5px">
    <div style="font:bold 18pt verdana;">
        Start Angle and Direction
    </div>
    <hr style="border:solid 1px #000080; background:#000080" />
    <div style="font:10pt verdana; margin-bottom:1.5em">
        <a href="viewsource.asp?file=<%= Request("SCRIPT_NAME") %>">View Chart Source Code</a>
    </div>
    <!-- ****** Here are the chart images ****** -->
    <%
        For i = 0 To Ubound(viewers)
            Call Response.Write(viewers(i).renderHTML())
            Call Response.Write(" ")
        Next
    %>
</body>
</html>
[Windows Version (in Visual Basic)] vbdemo\anglepie.cls
Public Sub createChart(viewer As Object, chartIndex As Integer)

    Dim cd As New ChartDirector.API

    ' The data for the pie chart
    Dim data()
    data = Array(25, 18, 15, 12, 8, 30, 35)

    ' The labels for the pie chart
    Dim labels()
    labels = Array("Labor", "Licenses", "Taxes", "Legal", "Insurance", "Facilities", "Production")

    ' Create a PieChart object of size 280 x 240 pixels
    Dim c As PieChart
    Set c = cd.PieChart(280, 240)

    ' Set the center of the pie at (140, 130) and the radius to 80 pixels
    Call c.setPieSize(140, 130, 80)

    ' Add a title to the pie to show the start angle and direction
    If chartIndex = 0 Then
        Call c.addTitle("Start Angle = 0 degrees<*br*>Direction = Clockwise")
    Else
        Call c.addTitle("Start Angle = 90 degrees<*br*>Direction = AntiClockwise")
        Call c.setStartAngle(90, False)
    End If

    ' Draw the pie in 3D
    Call c.set3D()

    ' Set the pie data and the pie labels
    Call c.setData(data, labels)

    ' Explode the 1st sector (index = 0)
    Call c.setExplode(0)

    ' Output the chart
    Set viewer.Picture = c.makePicture()

    'include tool tip for the chart
    viewer.ImageMap = c.getHTMLImageMap("clickable", "", _
        "title='{label}: US${value}K ({percent}%)'")

End Sub
© 2021 Advanced Software Engineering Limited. All rights reserved.