[Web Version (in ASP)] aspdemo\candlestick.asp
<%@ language="vbscript" %>
<%
Set cd = CreateObject("ChartDirector.API")
'
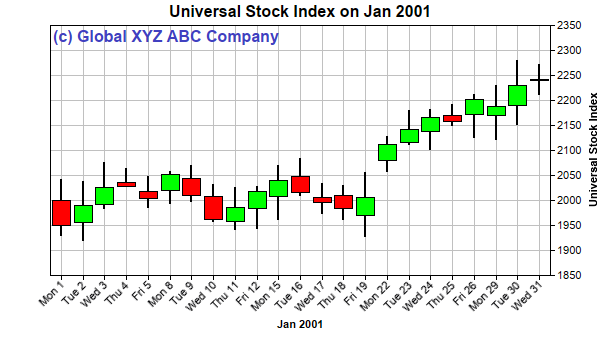
' Sample data for the CandleStick chart.
'
highData = Array(2043, 2039, 2076, 2064, 2048, 2058, 2070, 2033, 2027, 2029, 2071, 2085, 2034, _
2031, 2056, 2128, 2180, 2183, 2192, 2213, 2230, 2281, 2272)
lowData = Array(1931, 1921, 1985, 2028, 1986, 1994, 1999, 1958, 1943, 1944, 1962, 2011, 1975, _
1962, 1928, 2059, 2112, 2103, 2151, 2127, 2123, 2152, 2212)
openData = Array(2000, 1957, 1993, 2037, 2018, 2021, 2045, 2009, 1959, 1985, 2008, 2048, 2006, _
2010, 1971, 2080, 2116, 2137, 2170, 2172, 2171, 2191, 2240)
closeData = Array(1950, 1991, 2026, 2029, 2004, 2053, 2011, 1962, 1987, 2019, 2040, 2016, 1996, _
1985, 2006, 2113, 2142, 2167, 2158, 2201, 2188, 2231, 2242)
' The labels for the CandleStick chart
labels = Array("Mon 1", "Tue 2", "Wed 3", "Thu 4", "Fri 5", "Mon 8", "Tue 9", "Wed 10", "Thu 11", _
"Fri 12", "Mon 15", "Tue 16", "Wed 17", "Thu 18", "Fri 19", "Mon 22", "Tue 23", "Wed 24", _
"Thu 25", "Fri 26", "Mon 29", "Tue 30", "Wed 31")
' Create a XYChart object of size 600 x 350 pixels
Set c = cd.XYChart(600, 350)
' Set the plotarea at (50, 25) and of size 500 x 250 pixels. Enable both the horizontal and vertical
' grids by setting their colors to grey (0xc0c0c0)
Call c.setPlotArea(50, 25, 500, 250).setGridColor(&Hc0c0c0, &Hc0c0c0)
' Add a title to the chart
Call c.addTitle("Universal Stock Index on Jan 2001")
' Add a custom text at (50, 25) (the upper left corner of the plotarea). Use 12pt Arial Bold/blue
' (4040c0) as the font.
Call c.addText(50, 25, "(c) Global XYZ ABC Company", "Arial Bold", 12, &H4040c0)
' Add a title to the x axis
Call c.xAxis().setTitle("Jan 2001")
' Set the labels on the x axis. Rotate the labels by 45 degrees.
Call c.xAxis().setLabels(labels).setFontAngle(45)
' Add a title to the y axis
Call c.yAxis().setTitle("Universal Stock Index")
' Draw the y axis on the right hand side of the plot area
Call c.setYAxisOnRight(True)
' Add a CandleStick layer to the chart using green (00ff00) for up candles and red (ff0000) for down
' candles
Set layer = c.addCandleStickLayer(highData, lowData, openData, closeData, &H00ff00, &Hff0000)
' Set the line width to 2 pixels
Call layer.setLineWidth(2)
' Output the chart
Set viewer = cd.WebChartViewer(Request, "chart1")
Call viewer.setChart(c, cd.SVG)
' Include tool tip for the chart
viewer.ImageMap = c.getHTMLImageMap("", "", _
"title='{xLabel} Jan 2001<*br*>High:{high}<*br*>Open:{open}<*br*>Close:{close}<*br*>Low:{low}'")
%>
<!DOCTYPE html>
<html>
<head>
<title>Simple Candlestick Chart</title>
<!-- Include ChartDirector Javascript Library to support chart interactions -->
<script type="text/javascript" src="cdjcv.js"></script>
</head>
<body style="margin:5px 0px 0px 5px">
<div style="font:bold 18pt verdana;">
Simple Candlestick Chart
</div>
<hr style="border:solid 1px #000080; background:#000080" />
<div style="font:10pt verdana; margin-bottom:1.5em">
<a href="viewsource.asp?file=<%= Request("SCRIPT_NAME") %>">View Chart Source Code</a>
</div>
<!-- ****** Here is the chart image ****** -->
<%= viewer.renderHTML() %>
</body>
</html>
[Windows Version (in Visual Basic)] vbdemo\candlestick.cls
Public Sub createChart(viewer As Object, chartIndex As Integer)

    Dim cd As New ChartDirector.API

    '
    ' Sample data for the CandleStick chart.
    '
    Dim highData()
    highData = Array(2043, 2039, 2076, 2064, 2048, 2058, 2070, 2033, 2027, 2029, 2071, 2085, 2034, _
        2031, 2056, 2128, 2180, 2183, 2192, 2213, 2230, 2281, 2272)

    Dim lowData()
    lowData = Array(1931, 1921, 1985, 2028, 1986, 1994, 1999, 1958, 1943, 1944, 1962, 2011, 1975, _
        1962, 1928, 2059, 2112, 2103, 2151, 2127, 2123, 2152, 2212)

    Dim openData()
    openData = Array(2000, 1957, 1993, 2037, 2018, 2021, 2045, 2009, 1959, 1985, 2008, 2048, 2006, _
        2010, 1971, 2080, 2116, 2137, 2170, 2172, 2171, 2191, 2240)

    Dim closeData()
    closeData = Array(1950, 1991, 2026, 2029, 2004, 2053, 2011, 1962, 1987, 2019, 2040, 2016, _
        1996, 1985, 2006, 2113, 2142, 2167, 2158, 2201, 2188, 2231, 2242)

    ' The labels for the CandleStick chart
    Dim labels()
    labels = Array("Mon 1", "Tue 2", "Wed 3", "Thu 4", "Fri 5", "Mon 8", "Tue 9", "Wed 10", _
        "Thu 11", "Fri 12", "Mon 15", "Tue 16", "Wed 17", "Thu 18", "Fri 19", "Mon 22", "Tue 23", _
        "Wed 24", "Thu 25", "Fri 26", "Mon 29", "Tue 30", "Wed 31")

    ' Create a XYChart object of size 600 x 350 pixels
    Dim c As XYChart
    Set c = cd.XYChart(600, 350)

    ' Set the plotarea at (50, 25) and of size 500 x 250 pixels. Enable both the horizontal and
    ' vertical grids by setting their colors to grey (0xc0c0c0)
    Call c.setPlotArea(50, 25, 500, 250).setGridColor(&Hc0c0c0, &Hc0c0c0)

    ' Add a title to the chart
    Call c.addTitle("Universal Stock Index on Jan 2001")

    ' Add a custom text at (50, 25) (the upper left corner of the plotarea). Use 12pt Arial
    ' Bold/blue (4040c0) as the font.
    Call c.addText(50, 25, "(c) Global XYZ ABC Company", "arialbd.ttf", 12, &H4040c0)

    ' Add a title to the x axis
    Call c.xAxis().setTitle("Jan 2001")

    ' Set the labels on the x axis. Rotate the labels by 45 degrees.
    Call c.xAxis().setLabels(labels).setFontAngle(45)

    ' Add a title to the y axis
    Call c.yAxis().setTitle("Universal Stock Index")

    ' Draw the y axis on the right hand side of the plot area
    Call c.setYAxisOnRight(True)

    ' Add a CandleStick layer to the chart using green (00ff00) for up candles and red (ff0000) for
    ' down candles
    Dim layer As CandleStickLayer
    Set layer = c.addCandleStickLayer(highData, lowData, openData, closeData, &H00ff00, &Hff0000)

    ' Set the line width to 2 pixels
    Call layer.setLineWidth(2)

    ' Output the chart
    Set viewer.Picture = c.makePicture()

    'include tool tip for the chart
    viewer.ImageMap = c.getHTMLImageMap("clickable", "", _
        "title='{xLabel} Jan 2001 High:{high} Open:{open} Close:{close} Low:{low}'")

End Sub
© 2021 Advanced Software Engineering Limited. All rights reserved.