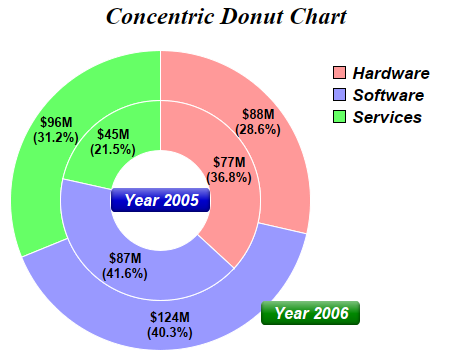
This example demonstrates creating concentric donut chart by merging two donuts of different radii.
The chart in this example is created as two separate
PieChart objects. The first PieChart represents the outer donut chart and the overall structure of the chart (such as the legend box, chart title, etc). The second PieChart has a
Transparent background and represents the inner donut chart. The two charts are merged together by using the
DrawArea.merge method.
[Web Version (in ASP)] aspdemo\concentric.asp
<%@ language="vbscript" %>
<%
Set cd = CreateObject("ChartDirector.API")

' Data for outer ring
data = Array(88, 124, 96)

' Data for inner ring
data2 = Array(77, 87, 45)

' Labels for the sectors
labels = Array("Hardware", "Software", "Services")

' Colors for the sectors
colors = Array(&Hff9999, &H9999ff, &H66ff66)

'
' Create the main chart, which contains the chart title, the outer ring, and the legend box
'

' Create a PieChart object of size 450 x 360 pixels, with transparent background
Set c = cd.PieChart(450, 360)

' Add a title to the chart with 18pt Times Bold Italic font
Call c.addTitle("Concentric Donut Chart", "Times New Roman Bold Italic", 18)

' Set donut center at (160, 200), and outer/inner radii as 150/100 pixels
Call c.setDonutSize(160, 200, 150, 100)

' Add a label at the bottom-right corner of the ring to label the outer ring Use 12pt Arial Bold
' Italic font in white (ffffff) color, on a green (008800) background, with soft lighting effect and
' 5 pixels rounded corners
Set t = c.addText(260, 300, " Year 2006 ", "Arial Bold Italic", 12, &Hffffff)
Call t.setBackground(&H008800, cd.Transparent, cd.softLighting())
Call t.setRoundedCorners(5)

' Set the legend box at (320, 50) with 12pt Arial Bold Italic font, with no border
Call c.addLegend(320, 50, True, "Arial Bold Italic", 13).setBackground(cd.Transparent, _
    cd.Transparent)

' Set the pie data and the pie labels
Call c.setData(data, labels)

' Set the pie colors
Call c.setColors2(cd.DataColor, colors)

' Set pie border color to white (ffffff)
Call c.setLineColor(&Hffffff)

' Set pie label to value in $###M format, percentage in (##.#%) format, in two lines.
Call c.setLabelFormat("${value}M<*br*>({percent|1}%)")

' Use 10pt Airal Bold for the sector labels
Call c.setLabelStyle("Arial Bold", 10)

' Set the label position to -25 pixels from the sector (which would be internal to the sector)
Call c.setLabelPos(-25)

'
' Create the inner ring.
'

' Create a PieChart object of size 280 x 320 pixels, with transparent background
Set c2 = cd.PieChart(280, 320, cd.Transparent)

' Set donut center at (110, 110), and outer/inner radii as 100/50 pixels
Call c2.setDonutSize(110, 110, 100, 50)

' Add a label at the center of the ring to label the inner ring. Use 12pt Arial Bold Italic font in
' white (ffffff) color, on a deep blue (0000cc) background, with soft lighting effect and 5 pixels
' rounded corners
Set t2 = c2.addText(110, 110, " Year 2005 ", "Arial Bold Italic", 12, &Hffffff, cd.Center)
Call t2.setBackground(&H0000cc, cd.Transparent, cd.softLighting())
Call t2.setRoundedCorners(5)

' Set the pie data and the pie labels
Call c2.setData(data2, labels)

' Set the pie colors
Call c2.setColors2(cd.DataColor, colors)

' Set pie border color to white (ffffff)
Call c2.setLineColor(&Hffffff)

' Set pie label to value in $###M format, percentage in (##.#%) format, in two lines.
Call c2.setLabelFormat("${value}M<*br*>({percent|1}%)")

' Use 10pt Airal Bold for the sector labels
Call c2.setLabelStyle("Arial Bold", 10)

' Set the label position to -25 pixels from the sector (which would be internal to the sector)
Call c2.setLabelPos(-25)

' merge the inner ring into the outer ring at (50, 90)
Call c.makeChart3().merge(c2.makeChart3(), 50, 90, cd.TopLeft, 0)

' Output the chart
Set viewer = cd.WebChartViewer(Request, "chart1")
Call viewer.setChart(c, cd.SVG)

' include tool tip for the chart
viewer.ImageMap = c2.getHTMLImageMap("", "", _
    "title='{label} revenue for 2005: US${value}M ({percent}%)'", 50, 90) & c.getHTMLImageMap("", _
    "", "title='{label} revenue for 2006: US${value}M ({percent}%)'")
%>

<!DOCTYPE html>
<html>
<head>
    <title>Concentric Donut Chart</title>
    <!-- Include ChartDirector Javascript Library to support chart interactions -->
    <script type="text/javascript" src="cdjcv.js"></script>
</head>
<body style="margin:5px 0px 0px 5px">
    <div style="font:bold 18pt verdana;">
        Concentric Donut Chart
    </div>
    <hr style="border:solid 1px #000080; background:#000080" />
    <div style="font:10pt verdana; margin-bottom:1.5em">
        <a href="viewsource.asp?file=<%= Request("SCRIPT_NAME") %>">View Chart Source Code</a>
    </div>
    <!-- ****** Here is the chart image ****** -->
    <%= viewer.renderHTML() %>
</body>
</html>
[Windows Version (in Visual Basic)] vbdemo\concentric.cls
Public Sub createChart(viewer As Object, chartIndex As Integer)

    Dim cd As New ChartDirector.API

    ' Data for outer ring
    Dim data()
    data = Array(88, 124, 96)

    ' Data for inner ring
    Dim data2()
    data2 = Array(77, 87, 45)

    ' Labels for the sectors
    Dim labels()
    labels = Array("Hardware", "Software", "Services")

    ' Colors for the sectors
    Dim colors()
    colors = Array(&Hff9999, &H9999ff, &H66ff66)

    '
    ' Create the main chart, which contains the chart title, the outer ring, and the legend box
    '

    ' Create a PieChart object of size 450 x 360 pixels, with transparent background
    Dim c As PieChart
    Set c = cd.PieChart(450, 360)

    ' Add a title to the chart with 18pt Times Bold Italic font
    Call c.addTitle("Concentric Donut Chart", "timesbi.ttf", 18)

    ' Set donut center at (160, 200), and outer/inner radii as 150/100 pixels
    Call c.setDonutSize(160, 200, 150, 100)

    ' Add a label at the bottom-right corner of the ring to label the outer ring Use 12pt Arial Bold
    ' Italic font in white (ffffff) color, on a green (008800) background, with soft lighting effect
    ' and 5 pixels rounded corners
    Dim t As ChartDirector.TextBox
    Set t = c.addText(260, 300, " Year 2006 ", "arialbi.ttf", 12, &Hffffff)
    Call t.setBackground(&H008800, cd.Transparent, cd.softLighting())
    Call t.setRoundedCorners(5)

    ' Set the legend box at (320, 50) with 12pt Arial Bold Italic font, with no border
    Call c.addLegend(320, 50, True, "arialbi.ttf", 13).setBackground(cd.Transparent, _
        cd.Transparent)

    ' Set the pie data and the pie labels
    Call c.setData(data, labels)

    ' Set the pie colors
    Call c.setColors2(cd.DataColor, colors)

    ' Set pie border color to white (ffffff)
    Call c.setLineColor(&Hffffff)

    ' Set pie label to value in $###M format, percentage in (##.#%) format, in two lines.
    Call c.setLabelFormat("${value}M<*br*>({percent|1}%)")

    ' Use 10pt Airal Bold for the sector labels
    Call c.setLabelStyle("arialbd.ttf", 10)

    ' Set the label position to -25 pixels from the sector (which would be internal to the sector)
    Call c.setLabelPos(-25)

    '
    ' Create the inner ring.
    '

    ' Create a PieChart object of size 280 x 320 pixels, with transparent background
    Dim c2 As PieChart
    Set c2 = cd.PieChart(280, 320, cd.Transparent)

    ' Set donut center at (110, 110), and outer/inner radii as 100/50 pixels
    Call c2.setDonutSize(110, 110, 100, 50)

    ' Add a label at the center of the ring to label the inner ring. Use 12pt Arial Bold Italic font
    ' in white (ffffff) color, on a deep blue (0000cc) background, with soft lighting effect and 5
    ' pixels rounded corners
    Dim t2 As ChartDirector.TextBox
    Set t2 = c2.addText(110, 110, " Year 2005 ", "arialbi.ttf", 12, &Hffffff, cd.Center)
    Call t2.setBackground(&H0000cc, cd.Transparent, cd.softLighting())
    Call t2.setRoundedCorners(5)

    ' Set the pie data and the pie labels
    Call c2.setData(data2, labels)

    ' Set the pie colors
    Call c2.setColors2(cd.DataColor, colors)

    ' Set pie border color to white (ffffff)
    Call c2.setLineColor(&Hffffff)

    ' Set pie label to value in $###M format, percentage in (##.#%) format, in two lines.
    Call c2.setLabelFormat("${value}M<*br*>({percent|1}%)")

    ' Use 10pt Airal Bold for the sector labels
    Call c2.setLabelStyle("arialbd.ttf", 10)

    ' Set the label position to -25 pixels from the sector (which would be internal to the sector)
    Call c2.setLabelPos(-25)

    ' merge the inner ring into the outer ring at (50, 90)
    Call c.makeChart3().merge(c2.makeChart3(), 50, 90, cd.TopLeft, 0)

    ' Output the chart
    Set viewer.Picture = c.makePicture()

    ' include tool tip for the chart
    viewer.ImageMap = c2.getHTMLImageMap("clickable", "", _
        "title='{label} revenue for 2005: US${value}M ({percent}%)'", 50, 90) + c.getHTMLImageMap( _
        "clickable", "", "title='{label} revenue for 2006: US${value}M ({percent}%)'")

End Sub
© 2021 Advanced Software Engineering Limited. All rights reserved.