[Web Version (in ASP)] aspdemo\contourcolor.asp
<%@ language="vbscript" %>
<%
Set cd = CreateObject("ChartDirector.API")
' This script can draw different charts depending on the chartIndex
Sub createChart(viewer, chartIndex)
' The x and y coordinates of the grid
dataX = Array(-4, -3, -2, -1, 0, 1, 2, 3, 4)
dataY = Array(-4, -3, -2, -1, 0, 1, 2, 3, 4)
' Use random numbers for the z values on the XY grid
Set r = cd.RanSeries(99)
dataZ = r.get2DSeries(UBound(dataX) + 1, UBound(dataY) + 1, -0.9, 0.9)
' Create a XYChart object of size 420 x 360 pixels
Set c = cd.XYChart(420, 360)
' Set the plotarea at (30, 25) and of size 300 x 300 pixels. Use semi-transparent grey
' (0xdd000000) horizontal and vertical grid lines
Call c.setPlotArea(30, 25, 300, 300, -1, -1, -1, &Hdd000000, -1)
' Set the x-axis and y-axis scale
Call c.xAxis().setLinearScale(-4, 4, 1)
Call c.yAxis().setLinearScale(-4, 4, 1)
' Add a contour layer using the given data
Set layer = c.addContourLayer(dataX, dataY, dataZ)
' Enable contour label by setting its style to black (000000) 8pt default bold font
Call layer.setContourLabelStyle("bold", 8, &H000000)
' Set the label to display the value in a CDML block with semi-transparent white (4FFFFFFF)
' background and 2 pixels left/right margin and 1 pixel top/bottom margin
Call layer.setContourLabelFormat("<*block,bgcolor=4FFFFFFF,margin=2 2 1 1*>{value}")
' Move the grid lines in front of the contour layer
Call c.getPlotArea().moveGridBefore(layer)
' Add a color axis (the legend) in which the top left corner is anchored at (350, 25). Set the
' length to 400 300 and the labels on the right side.
Set cAxis = layer.setColorAxis(350, 25, cd.TopLeft, 300, cd.Right)
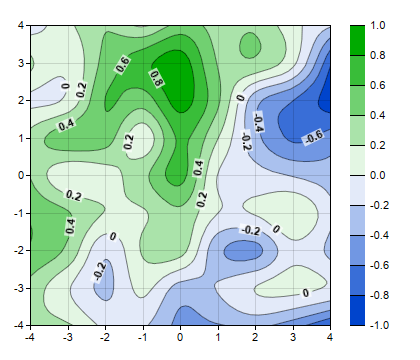
If chartIndex = 1 Then
' Speicify a color gradient as a list of colors, and use it in the color axis.
colorGradient = Array(&H0044cc, &Hffffff, &H00aa00)
Call cAxis.setColorGradient(False, colorGradient)
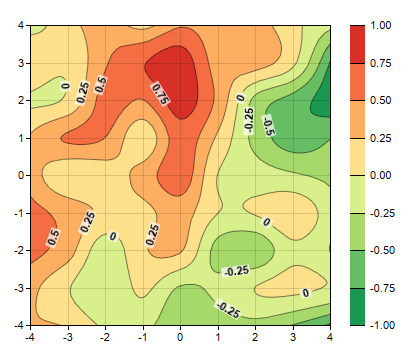
ElseIf chartIndex = 2 Then
' Specify the color scale to use in the color axis
colorScale = Array(-1.0, &H1a9850, -0.75, &H66bd63, -0.5, &Ha6d96a, -0.25, &Hd9ef8b, 0, _
&Hfee08b, 0.25, &Hfdae61, 0.5, &Hf46d43, 0.75, &Hd73027, 1)
Call cAxis.setColorScale(colorScale)
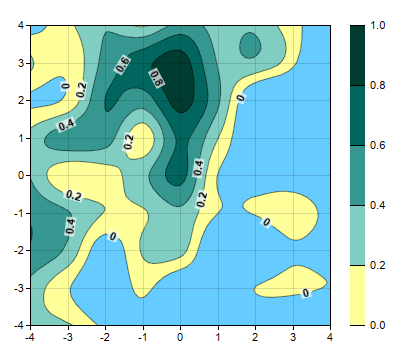
ElseIf chartIndex = 3 Then
' Specify the color scale to use in the color axis. Also specify an underflow color 0x66ccff
' (blue) for regions that fall below the lower axis limit.
colorScale = Array(0, &Hffff99, 0.2, &H80cdc1, 0.4, &H35978f, 0.6, &H01665e, 0.8, _
&H003c30, 1)
Call cAxis.setColorScale(colorScale, &H66ccff)
End If
' Output the chart
Call viewer.setChart(c, cd.SVG)
' Include tool tip for the chart
viewer.ImageMap = c.getHTMLImageMap("", "", _
"title='<*cdml*><*b*>X: {x|2}<*br*>Y: {y|2}<*br*>Z: {z|2}'")
' Output Javascript chart model to support contour chart tooltips
viewer.ChartModel = c.getJsChartModel()
End Sub
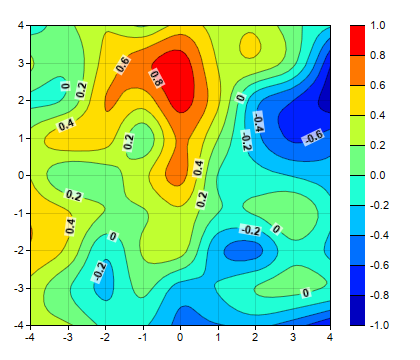
' This example includes 4 charts
Dim viewers(3)
For i = 0 To Ubound(viewers)
Set viewers(i) = cd.WebChartViewer(Request, "chart" & i)
Call createChart(viewers(i), i)
Next
%>
<!DOCTYPE html>
<html>
<head>
<title>Contour Color Scale</title>
<!-- Include ChartDirector Javascript Library to support chart interactions -->
<script type="text/javascript" src="cdjcv.js"></script>
</head>
<body style="margin:5px 0px 0px 5px">
<div style="font:bold 18pt verdana;">
Contour Color Scale
</div>
<hr style="border:solid 1px #000080; background:#000080" />
<div style="font:10pt verdana; margin-bottom:1.5em">
<a href="viewsource.asp?file=<%= Request("SCRIPT_NAME") %>">View Chart Source Code</a>
</div>
<!-- ****** Here are the chart images ****** -->
<%
For i = 0 To Ubound(viewers)
Call Response.Write(viewers(i).renderHTML())
Call Response.Write(" ")
Next
%>
</body>
</html>
[Windows Version (in Visual Basic)] vbdemo\contourcolor.cls
Public Sub createChart(viewer As Object, chartIndex As Integer)

    Dim cd As New ChartDirector.API

    ' The x and y coordinates of the grid
    Dim dataX()
    dataX = Array(-4, -3, -2, -1, 0, 1, 2, 3, 4)
    Dim dataY()
    dataY = Array(-4, -3, -2, -1, 0, 1, 2, 3, 4)

    ' Use random numbers for the z values on the XY grid
    Dim r As RanSeries
    Set r = cd.RanSeries(99)
    Dim dataZ()
    dataZ = r.get2DSeries(UBound(dataX) + 1, UBound(dataY) + 1, -0.9, 0.9)

    ' Create a XYChart object of size 420 x 360 pixels
    Dim c As XYChart
    Set c = cd.XYChart(420, 360)

    ' Set the plotarea at (30, 25) and of size 300 x 300 pixels. Use semi-transparent grey
    ' (0xdd000000) horizontal and vertical grid lines
    Call c.setPlotArea(30, 25, 300, 300, -1, -1, -1, &Hdd000000, -1)

    ' Set the x-axis and y-axis scale
    Call c.xAxis().setLinearScale(-4, 4, 1)
    Call c.yAxis().setLinearScale(-4, 4, 1)

    ' Add a contour layer using the given data
    Dim layer As ContourLayer
    Set layer = c.addContourLayer(dataX, dataY, dataZ)

    ' Move the grid lines in front of the contour layer
    Call c.getPlotArea().moveGridBefore(layer)

    ' Add a color axis (the legend) in which the top left corner is anchored at (350, 25). Set the
    ' length to 400 300 and the labels on the right side.
    Dim cAxis As ColorAxis
    Set cAxis = layer.setColorAxis(350, 25, cd.TopLeft, 300, cd.Right)

    If chartIndex = 1 Then
        ' Speicify a color gradient as a list of colors, and use it in the color axis.
        Dim colorGradient()
        colorGradient = Array(&H0044cc, &Hffffff, &H00aa00)
        Call cAxis.setColorGradient(False, colorGradient)
    ElseIf chartIndex = 2 Then
        ' Specify the color scale to use in the color axis
        Dim colorScale()
        colorScale = Array(-1.0, &H1a9850, -0.75, &H66bd63, -0.5, &Ha6d96a, -0.25, &Hd9ef8b, 0, _
            &Hfee08b, 0.25, &Hfdae61, 0.5, &Hf46d43, 0.75, &Hd73027, 1)
        Call cAxis.setColorScale(colorScale)
    ElseIf chartIndex = 3 Then
        ' Specify the color scale to use in the color axis. Also specify an underflow color 0x66ccff
        ' (blue) for regions that fall below the lower axis limit.
        colorScale = Array(0, &Hffff99, 0.2, &H80cdc1, 0.4, &H35978f, 0.6, &H01665e, 0.8, _
            &H003c30, 1)
        Call cAxis.setColorScale(colorScale, &H66ccff)
    End If

    ' Output the chart
    Set viewer.Picture = c.makePicture()

End Sub
© 2021 Advanced Software Engineering Limited. All rights reserved.