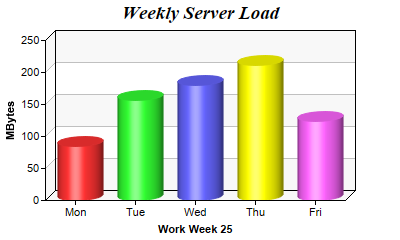
This example demonstrates bars of cylinder shape.
ChartDirector supports bars in cylindrical or arbitrary polygonal shapes. The shape are specified using
BarLayer.setBarShape or
BarLayer.setBarShape2. In this example, the cylindrical shape is illustrated.
See
Shape Specification on how built-in and custom shapes are defined in ChartDirector.
[Web Version (in ASP)] aspdemo\cylinderbar.asp
<%@ language="vbscript" %>
<%
Set cd = CreateObject("ChartDirector.API")

' The data for the bar chart
data = Array(85, 156, 179.5, 211, 123)

' The labels for the bar chart
labels = Array("Mon", "Tue", "Wed", "Thu", "Fri")

' Create a XYChart object of size 400 x 240 pixels.
Set c = cd.XYChart(400, 240)

' Add a title to the chart using 14pt Times Bold Italic font
Call c.addTitle("Weekly Server Load", "Times New Roman Bold Italic", 14)

' Set the plotarea at (45, 40) and of 300 x 160 pixels in size. Use alternating light grey (f8f8f8)
' / white (ffffff) background.
Call c.setPlotArea(45, 40, 300, 160, &Hf8f8f8, &Hffffff)

' Add a multi-color bar chart layer
Set layer = c.addBarLayer3(data)

' Set layer to 3D with 10 pixels 3D depth
Call layer.set3D(10)

' Set bar shape to circular (cylinder)
Call layer.setBarShape(cd.CircleShape)

' Set the labels on the x axis.
Call c.xAxis().setLabels(labels)

' Add a title to the y axis
Call c.yAxis().setTitle("MBytes")

' Add a title to the x axis
Call c.xAxis().setTitle("Work Week 25")

' Output the chart
Set viewer = cd.WebChartViewer(Request, "chart1")
Call viewer.setChart(c, cd.SVG)

' Include tool tip for the chart
viewer.ImageMap = c.getHTMLImageMap("", "", "title='{xLabel}: {value} MBytes'")
%>

<!DOCTYPE html>
<html>
<head>
    <title>Cylinder Bar Shape</title>
    <!-- Include ChartDirector Javascript Library to support chart interactions -->
    <script type="text/javascript" src="cdjcv.js"></script>
</head>
<body style="margin:5px 0px 0px 5px">
    <div style="font:bold 18pt verdana;">
        Cylinder Bar Shape
    </div>
    <hr style="border:solid 1px #000080; background:#000080" />
    <div style="font:10pt verdana; margin-bottom:1.5em">
        <a href="viewsource.asp?file=<%= Request("SCRIPT_NAME") %>">View Chart Source Code</a>
    </div>
    <!-- ****** Here is the chart image ****** -->
    <%= viewer.renderHTML() %>
</body>
</html>
[Windows Version (in Visual Basic)] vbdemo\cylinderbar.cls
Public Sub createChart(viewer As Object, chartIndex As Integer)

    Dim cd As New ChartDirector.API

    ' The data for the bar chart
    Dim data()
    data = Array(85, 156, 179.5, 211, 123)

    ' The labels for the bar chart
    Dim labels()
    labels = Array("Mon", "Tue", "Wed", "Thu", "Fri")

    ' Create a XYChart object of size 400 x 240 pixels.
    Dim c As XYChart
    Set c = cd.XYChart(400, 240)

    ' Add a title to the chart using 14pt Times Bold Italic font
    Call c.addTitle("Weekly Server Load", "timesbi.ttf", 14)

    ' Set the plotarea at (45, 40) and of 300 x 160 pixels in size. Use alternating light grey
    ' (f8f8f8) / white (ffffff) background.
    Call c.setPlotArea(45, 40, 300, 160, &Hf8f8f8, &Hffffff)

    ' Add a multi-color bar chart layer
    Dim layer As BarLayer
    Set layer = c.addBarLayer3(data)

    ' Set layer to 3D with 10 pixels 3D depth
    Call layer.set3D(10)

    ' Set bar shape to circular (cylinder)
    Call layer.setBarShape(cd.CircleShape)

    ' Set the labels on the x axis.
    Call c.xAxis().setLabels(labels)

    ' Add a title to the y axis
    Call c.yAxis().setTitle("MBytes")

    ' Add a title to the x axis
    Call c.xAxis().setTitle("Work Week 25")

    ' Output the chart
    Set viewer.Picture = c.makePicture()

    'include tool tip for the chart
    viewer.ImageMap = c.getHTMLImageMap("clickable", "", "title='{xLabel}: {value} MBytes'")

End Sub
© 2021 Advanced Software Engineering Limited. All rights reserved.