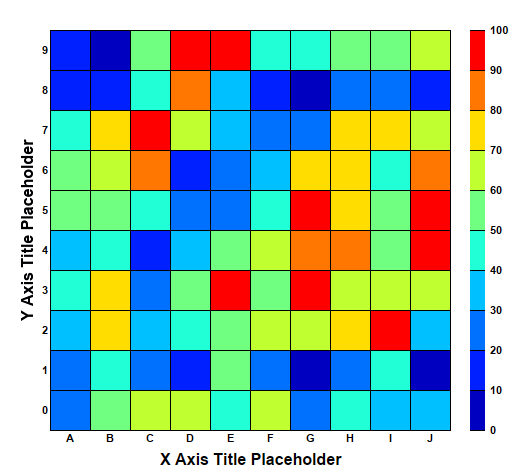
This example demonstrates the basic steps in creating a discrete heat map.
A discrete heat map consists of rectangular cells in a grid of which the cell color depends on its data value.
[Web Version (in ASP)] aspdemo\discreteheatmap.asp
<%@ language="vbscript" %>
<%
Set cd = CreateObject("ChartDirector.API")

' The x-axis and y-axis labels
xLabels = Array("A", "B", "C", "D", "E", "F", "G", "H", "I", "J")
yLabels = Array("0", "1", "2", "3", "4", "5", "6", "7", "8", "9")

' Random data for the 10 x 10 cells
Set r = cd.RanSeries(2)
zData = r.get2DSeries(UBound(xLabels) + 1, UBound(yLabels) + 1, 0, 100)

' Create an XYChart object of size 520 x 470 pixels.
Set c = cd.XYChart(520, 470)

' Set the plotarea at (50, 30) and of size 400 x 400 pixels.
Set p = c.setPlotArea(50, 30, 400, 400)

' Create a discrete heat map with 10 x 10 cells
Set layer = c.addDiscreteHeatMapLayer(zData, UBound(xLabels) + 1)

' Set the x-axis labels. Use 8pt Arial Bold font. Set axis stem to transparent, so only the labels
' are visible. Set 0.5 offset to position the labels in between the grid lines.
Call c.xAxis().setLabels(xLabels)
Call c.xAxis().setLabelStyle("Arial Bold", 8)
Call c.xAxis().setColors(cd.Transparent, cd.TextColor)
Call c.xAxis().setLabelOffset(0.5)
Call c.xAxis().setTitle("X Axis Title Placeholder", "Arial Bold", 12)

' Set the y-axis labels. Use 8pt Arial Bold font. Set axis stem to transparent, so only the labels
' are visible. Set 0.5 offset to position the labels in between the grid lines.
Call c.yAxis().setLabels(yLabels)
Call c.yAxis().setLabelStyle("Arial Bold", 8)
Call c.yAxis().setColors(cd.Transparent, cd.TextColor)
Call c.yAxis().setLabelOffset(0.5)
Call c.yAxis().setTitle("Y Axis Title Placeholder", "Arial Bold", 12)

' Position the color axis 20 pixels to the right of the plot area and of the same height as the plot
' area. Put the labels on the right side of the color axis. Use 8pt Arial Bold font for the labels.
Set cAxis = layer.setColorAxis(p.getRightX() + 20, p.getTopY(), cd.TopLeft, p.getHeight(), _
    cd.Right)
Call cAxis.setLabelStyle("Arial Bold", 8)

' Output the chart
Set viewer = cd.WebChartViewer(Request, "chart1")
Call viewer.setChart(c, cd.SVG)

' Include tool tip for the chart
viewer.ImageMap = c.getHTMLImageMap("", "", "title='<*cdml*>({xLabel}, {yLabel}) = {z|2}'")
%>

<!DOCTYPE html>
<html>
<head>
    <title>Discrete Heat Map</title>
    <!-- Include ChartDirector Javascript Library to support chart interactions -->
    <script type="text/javascript" src="cdjcv.js"></script>
</head>
<body style="margin:5px 0px 0px 5px">
    <div style="font:bold 18pt verdana;">
        Discrete Heat Map
    </div>
    <hr style="border:solid 1px #000080; background:#000080" />
    <div style="font:10pt verdana; margin-bottom:1.5em">
        <a href="viewsource.asp?file=<%= Request("SCRIPT_NAME") %>">View Chart Source Code</a>
    </div>
    <!-- ****** Here is the chart image ****** -->
    <%= viewer.renderHTML() %>
</body>
</html>
© 2021 Advanced Software Engineering Limited. All rights reserved.