[Web Version (in ASP)] aspdemo\donut.asp
<%@ language="vbscript" %>
<%
Set cd = CreateObject("ChartDirector.API")
' The data for the pie chart
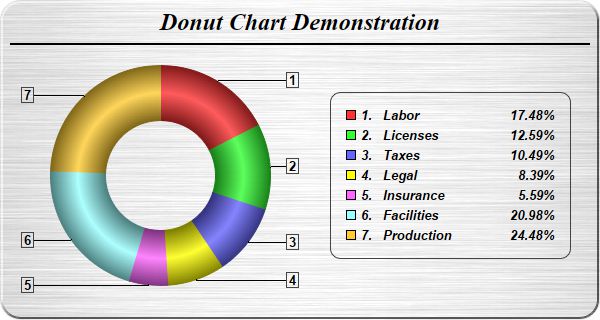
data = Array(25, 18, 15, 12, 8, 30, 35)
' The labels for the pie chart
labels = Array("Labor", "Licenses", "Taxes", "Legal", "Insurance", "Facilities", "Production")
' Create a PieChart object of size 600 x 320 pixels. Set background color to brushed silver, with a
' 2 pixel 3D border. Use rounded corners of 20 pixels radius.
Set c = cd.PieChart(600, 320, cd.brushedSilverColor(), cd.Transparent, 2)
Call c.setRoundedFrame(&Hffffff, 20)
' Add a title using 18pt Times New Roman Bold Italic font. #Set top/bottom margins to 8 pixels.
Set title = c.addTitle("Donut Chart Demonstration", "Times New Roman Bold Italic", 18)
Call title.setMargin2(0, 0, 8, 8)
' Add a 2 pixels wide separator line just under the title
Call c.addLine(10, title.getHeight(), c.getWidth() - 11, title.getHeight(), cd.LineColor, 2)
' Set donut center at (160, 175), and outer/inner radii as 110/55 pixels
Call c.setDonutSize(160, 175, 110, 55)
' Set the pie data and the pie labels
Call c.setData(data, labels)
' Use ring shading effect for the sectors
Call c.setSectorStyle(cd.RingShading)
' Use the side label layout method, with the labels positioned 16 pixels from the donut bounding box
Call c.setLabelLayout(cd.SideLayout, 16)
' Show only the sector number as the sector label
Call c.setLabelFormat("{={sector}+1}")
' Set the sector label style to Arial Bold 10pt, with a dark grey (444444) border
Call c.setLabelStyle("Arial Bold", 10).setBackground(cd.Transparent, &H444444)
' Add a legend box, with the center of the left side anchored at (330, 175), and using 10pt Arial
' Bold Italic font
Set b = c.addLegend(330, 175, True, "Arial Bold Italic", 10)
Call b.setAlignment(cd.Left)
' Set the legend box border to dark grey (444444), and with rounded conerns
Call b.setBackground(cd.Transparent, &H444444)
Call b.setRoundedCorners()
' Set the legend box margin to 16 pixels, and the extra line spacing between the legend entries as 5
' pixels
Call b.setMargin(16)
Call b.setKeySpacing(0, 5)
' Set the legend text to show the sector number, followed by a 120 pixels wide block showing the
' sector label, and a 40 pixels wide block showing the percentage
Call b.setText( _
"<*block,valign=top*>{={sector}+1}.<*advanceTo=22*><*block,width=120*>{label}<*/*>" & _
"<*block,width=40,halign=right*>{percent}<*/*>%")
' Output the chart
Set viewer = cd.WebChartViewer(Request, "chart1")
Call viewer.setChart(c, cd.SVG)
' Include tool tip for the chart
viewer.ImageMap = c.getHTMLImageMap("", "", "title='{label}: US${value}K ({percent}%)'")
%>
<!DOCTYPE html>
<html>
<head>
<title>Donut Chart</title>
<!-- Include ChartDirector Javascript Library to support chart interactions -->
<script type="text/javascript" src="cdjcv.js"></script>
</head>
<body style="margin:5px 0px 0px 5px">
<div style="font:bold 18pt verdana;">
Donut Chart
</div>
<hr style="border:solid 1px #000080; background:#000080" />
<div style="font:10pt verdana; margin-bottom:1.5em">
<a href="viewsource.asp?file=<%= Request("SCRIPT_NAME") %>">View Chart Source Code</a>
</div>
<!-- ****** Here is the chart image ****** -->
<%= viewer.renderHTML() %>
</body>
</html>
[Windows Version (in Visual Basic)] vbdemo\donut.cls
Public Sub createChart(viewer As Object, chartIndex As Integer)

    Dim cd As New ChartDirector.API

    ' The data for the pie chart
    Dim data()
    data = Array(25, 18, 15, 12, 8, 30, 35)

    ' The labels for the pie chart
    Dim labels()
    labels = Array("Labor", "Licenses", "Taxes", "Legal", "Insurance", "Facilities", "Production")

    ' Create a PieChart object of size 600 x 320 pixels. Set background color to brushed silver,
    ' with a 2 pixel 3D border. Use rounded corners of 20 pixels radius.
    Dim c As PieChart
    Set c = cd.PieChart(600, 320, cd.brushedSilverColor(), cd.Transparent, 2)
    Call c.setRoundedFrame(&Hffffff, 20)

    ' Add a title using 18pt Times New Roman Bold Italic font. #Set top/bottom margins to 8 pixels.
    Dim title As ChartDirector.TextBox
    Set title = c.addTitle("Donut Chart Demonstration", "timesbi.ttf", 18)
    Call title.setMargin2(0, 0, 8, 8)

    ' Add a 2 pixels wide separator line just under the title
    Call c.addLine(10, title.getHeight(), c.getWidth() - 11, title.getHeight(), cd.LineColor, 2)

    ' Set donut center at (160, 175), and outer/inner radii as 110/55 pixels
    Call c.setDonutSize(160, 175, 110, 55)

    ' Set the pie data and the pie labels
    Call c.setData(data, labels)

    ' Use ring shading effect for the sectors
    Call c.setSectorStyle(cd.RingShading)

    ' Use the side label layout method, with the labels positioned 16 pixels from the donut bounding
    ' box
    Call c.setLabelLayout(cd.SideLayout, 16)

    ' Show only the sector number as the sector label
    Call c.setLabelFormat("{={sector}+1}")

    ' Set the sector label style to Arial Bold 10pt, with a dark grey (444444) border
    Call c.setLabelStyle("arialbd.ttf", 10).setBackground(cd.Transparent, &H444444)

    ' Add a legend box, with the center of the left side anchored at (330, 175), and using 10pt
    ' Arial Bold Italic font
    Dim b As LegendBox
    Set b = c.addLegend(330, 175, True, "arialbi.ttf", 10)
    Call b.setAlignment(cd.Left)

    ' Set the legend box border to dark grey (444444), and with rounded conerns
    Call b.setBackground(cd.Transparent, &H444444)
    Call b.setRoundedCorners()

    ' Set the legend box margin to 16 pixels, and the extra line spacing between the legend entries
    ' as 5 pixels
    Call b.setMargin(16)
    Call b.setKeySpacing(0, 5)

    ' Set the legend text to show the sector number, followed by a 120 pixels wide block showing the
    ' sector label, and a 40 pixels wide block showing the percentage
    Call b.setText( _
        "<*block,valign=top*>{={sector}+1}.<*advanceTo=22*><*block,width=120*>{label}<*/*>" & _
        "<*block,width=40,halign=right*>{percent}<*/*>%")

    ' Output the chart
    Set viewer.Picture = c.makePicture()

    'include tool tip for the chart
    viewer.ImageMap = c.getHTMLImageMap("clickable", "", _
        "title='{label}: US${value}K ({percent}%)'")

End Sub
© 2021 Advanced Software Engineering Limited. All rights reserved.