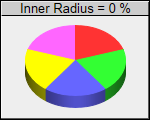

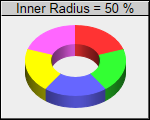
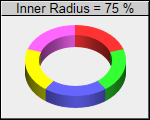
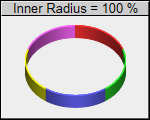
This example demonstrates the effects of different donut widths.
Donut widths are configured by using different inner and outer radii when calling PieChart.setDonutSize.
ChartDirector 7.0 (ASP/COM/VB Edition)
Donut Width
Source Code Listing
<%@ language="vbscript" %>
<%
Set cd = CreateObject("ChartDirector.API")

' This script can draw different charts depending on the chartIndex
Sub createChart(viewer, chartIndex)

    ' Determine the donut inner radius (as percentage of outer radius) based on input parameter
    donutRadius = chartIndex * 25

    ' The data for the pie chart
    data = Array(10, 10, 10, 10, 10)

    ' The labels for the pie chart
    labels = Array("Marble", "Wood", "Granite", "Plastic", "Metal")

    ' Create a PieChart object of size 150 x 120 pixels, with a grey (EEEEEE) background, black
    ' border and 1 pixel 3D border effect
    Set c = cd.PieChart(150, 120, &Heeeeee, &H000000, 1)

    ' Set donut center at (75, 65) and the outer radius to 50 pixels. Inner radius is computed
    ' according donutWidth
    Call c.setDonutSize(75, 60, 50, Int(50 * donutRadius / 100))

    ' Add a title to show the donut width
    Call c.addTitle("Inner Radius = " & donutRadius & " %", "Arial", 10).setBackground(&Hcccccc, 0)

    ' Draw the pie in 3D
    Call c.set3D(12)

    ' Set the pie data and the pie labels
    Call c.setData(data, labels)

    ' Disable the sector labels by setting the color to Transparent
    Call c.setLabelStyle("", 8, cd.Transparent)

    ' Output the chart
    Call viewer.setChart(c, cd.SVG)

    ' Include tool tip for the chart
    viewer.ImageMap = c.getHTMLImageMap("", "", "title='{label}: {value}kg ({percent}%)'")
End Sub

' This example includes 5 charts
Dim viewers(4)
For i = 0 To Ubound(viewers)
    Set viewers(i) = cd.WebChartViewer(Request, "chart" & i)
    Call createChart(viewers(i), i)
Next
%>

<!DOCTYPE html>
<html>
<head>
    <title>Donut Width</title>
    <!-- Include ChartDirector Javascript Library to support chart interactions -->
    <script type="text/javascript" src="cdjcv.js"></script>
</head>
<body style="margin:5px 0px 0px 5px">
    <div style="font:bold 18pt verdana;">
        Donut Width
    </div>
    <hr style="border:solid 1px #000080; background:#000080" />
    <div style="font:10pt verdana; margin-bottom:1.5em">
        <a href="viewsource.asp?file=<%= Request("SCRIPT_NAME") %>">View Chart Source Code</a>
    </div>
    <!-- ****** Here are the chart images ****** -->
    <%
        For i = 0 To Ubound(viewers)
            Call Response.Write(viewers(i).renderHTML())
            Call Response.Write(" ")
        Next
    %>
</body>
</html>Public Sub createChart(viewer As Object, chartIndex As Integer)
Dim cd As New ChartDirector.API
' Determine the donut inner radius (as percentage of outer radius) based on input parameter
Dim donutRadius As Long
donutRadius = chartIndex * 25
' The data for the pie chart
Dim data()
data = Array(10, 10, 10, 10, 10)
' The labels for the pie chart
Dim labels()
labels = Array("Marble", "Wood", "Granite", "Plastic", "Metal")
' Create a PieChart object of size 150 x 120 pixels, with a grey (EEEEEE) background, black
' border and 1 pixel 3D border effect
Dim c As PieChart
Set c = cd.PieChart(150, 120, &Heeeeee, &H000000, 1)
' Set donut center at (75, 65) and the outer radius to 50 pixels. Inner radius is computed
' according donutWidth
Call c.setDonutSize(75, 60, 50, Int(50 * donutRadius / 100))
' Add a title to show the donut width
Call c.addTitle("Inner Radius = " & donutRadius & " %", "arial.ttf", 10).setBackground( _
&Hcccccc, 0)
' Draw the pie in 3D
Call c.set3D(12)
' Set the pie data and the pie labels
Call c.setData(data, labels)
' Disable the sector labels by setting the color to Transparent
Call c.setLabelStyle("", 8, cd.Transparent)
' Output the chart
Set viewer.Picture = c.makePicture()
'include tool tip for the chart
viewer.ImageMap = c.getHTMLImageMap("clickable", "", "title='{label}: {value}kg ({percent}%)'")
End Sub