This section introduces using ChartDirector in Windows applications. If you are using ChartDirector in ASP, you may refer to The First ASP Project instead.
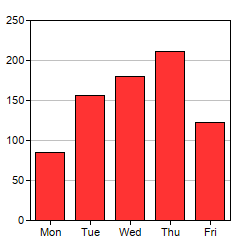
To get a feeling of using ChartDirector, and to verify the ChartDirector development environment is set up properly, we will begin by building a very simple bar chart.
The following code module comes from the sample VB project "VBChartDemo.vbp" that is included in the ChartDirector installation. The sample VB project contains an "explorer" style user interface for browsing various sample charts, and each sample chart is implemented in a VB class module.
If you have not yet tried the sample programs, it is highly recommended you try them now. Please refer to the Installation section for details. They are very useful for exploring and testing the features of ChartDirector.
[Windows Version (in Visual Basic)] vbdemo\simplebar.cls
Public Sub createChart(viewer As Object, chartIndex As Integer)

    Dim cd As New ChartDirector.API

    ' The data for the bar chart
    Dim data()
    data = Array(85, 156, 179.5, 211, 123)

    ' The labels for the bar chart
    Dim labels()
    labels = Array("Mon", "Tue", "Wed", "Thu", "Fri")

    ' Create a XYChart object of size 250 x 250 pixels
    Dim c As XYChart
    Set c = cd.XYChart(250, 250)

    ' Set the plotarea at (30, 20) and of size 200 x 200 pixels
    Call c.setPlotArea(30, 20, 200, 200)

    ' Add a bar chart layer using the given data
    Call c.addBarLayer(data)

    ' Set the labels on the x axis.
    Call c.xAxis().setLabels(labels)

    ' Output the chart
    Set viewer.Picture = c.makePicture()

    'include tool tip for the chart
    viewer.ImageMap = c.getHTMLImageMap("clickable", "", "title='{xLabel}: {value} GBytes'")

End Sub
The code is explained below:
Dim cd As New ChartDirector.API
The ChartDirector API is encapsulated in a COM Automation object called "ChartDirector.API". This line creates the ChartDirector.API object for accessing the ChartDirector API.
For the above code to work, the VB project needs to have "ChartDirector" added as reference (using Project/Reference in the VB IDE). The sample project "VBChartDemo.vbp" already has this reference added.
Set c = cd.XYChart(250, 250)
The first step in creating any chart in ChartDirector is to create the appropriate chart object. In this example, an XYChart object of size 250 x 250 pixels is created. In ChartDirector, XYChart represents any chart that has x-axis and y-axis, such as the bar chart we are drawing.
Call c.setPlotArea(30, 20, 200, 200)
The second step in creating a bar chart is to specify where should we draw the bar chart. This is by specifying the rectangle that contains the bar chart. The rectangle is specified by using the (x, y) coordinates of its top-left corner, together with its width and height.
For this simple bar chart, we will use the majority of the chart area to draw the bar chart. We will leave some margin to allow for the text labels on the axis. In the above code, the top-left corner is set to (30, 30), and both the width and height is set to 200 pixels. Since the entire chart is 250 x 250 in size, there will be 20 to 30 pixels margin for the text labels.
Note that ChartDirector uses a pixel coordinate system that is customary for computer screen. The x pixel coordinate is increasing from left to right. The y pixel coordinate is increasing from top to bottom. The origin (0, 0) is at the top-left corner.
For more complex charts which may contain titles, legend box and other things, we can use this method (and other methods) to design the exact layout of the entire chart.
Call c.addBarLayer(data)
The above code adds a bar layer to the XYChart. In ChartDirector, any chart type that has x-axis and y-axis is represented as a layer in the XYChart. An XYChart can contain multiple layers. This allows "combination charts" to be created easily by combining different layers on the same chart (eg., a chart containing a line layer on top of a bar layer) .
In the above line of code, the argument is an array of numbers representing the values of the data points.
Call c.xAxis().setLabels( labels)
The above code sets the labels on the x-axis. The first method XYChart.xAxis retrieves the Axis object that represents the x-axis. The second method Axis.setLabels binds the text labels to the x-axis. The argument to the setLabels method is an array of text strings.
Set viewer.Picture = c.makePicture()
In this project, we will output the chart as a standard OLE IPicture object, and assign it to a ChartViewer control for display. The "viewer" variable above is a reference to a ChartViewer control on a Form.
Besides displaying the chart using the ChartViewer, ChartDirector also supports other output methods, such as creating the chart as an image file using BaseChart.makeChart, or as an image in memory using BaseChart.makeChart2.
Set viewer.ImageMap = c.getHTMLImageMap("clickable", "", "title= '{xLabel}: {value} GBytes'")
After creating the chart, an image map can be created for the chart to support mouse interactions. In this example, the image map is configured to display tool tips of the format"title='{xLabel}: {value} GBytes'"when the mouse cursor is on top of the bars.
Note: The trial version of ChartDirector will include small yellow banners at the bottom of the charts it produces. These banners will disappear in the licensed version of ChartDirector.