[Web Version (in ASP)] aspdemo\gantt.asp
<%@ language="vbscript" %>
<%
Set cd = CreateObject("ChartDirector.API")
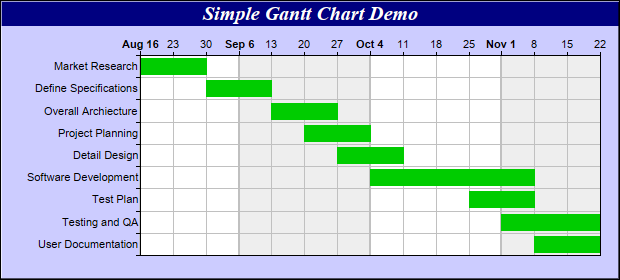
' data for the gantt chart, representing the start date, end date and names for various activities
startDate = Array(DateSerial(2004, 8, 16), DateSerial(2004, 8, 30), DateSerial(2004, 9, 13), _
DateSerial(2004, 9, 20), DateSerial(2004, 9, 27), DateSerial(2004, 10, 4), DateSerial(2004, _
10, 25), DateSerial(2004, 11, 1), DateSerial(2004, 11, 8))
endDate = Array(DateSerial(2004, 8, 30), DateSerial(2004, 9, 13), DateSerial(2004, 9, 27), _
DateSerial(2004, 10, 4), DateSerial(2004, 10, 11), DateSerial(2004, 11, 8), DateSerial(2004, _
11, 8), DateSerial(2004, 11, 22), DateSerial(2004, 11, 22))
labels = Array("Market Research", "Define Specifications", "Overall Archiecture", _
"Project Planning", "Detail Design", "Software Development", "Test Plan", "Testing and QA", _
"User Documentation")
' Create a XYChart object of size 620 x 280 pixels. Set background color to light blue (ccccff),
' with 1 pixel 3D border effect.
Set c = cd.XYChart(620, 280, &Hccccff, &H000000, 1)
' Add a title to the chart using 15 points Times Bold Itatic font, with white (ffffff) text on a
' deep blue (000080) background
Call c.addTitle("Simple Gantt Chart Demo", "Times New Roman Bold Italic", 15, &Hffffff _
).setBackground(&H000080)
' Set the plotarea at (140, 55) and of size 460 x 200 pixels. Use alternative white/grey background.
' Enable both horizontal and vertical grids by setting their colors to grey (c0c0c0). Set vertical
' major grid (represents month boundaries) 2 pixels in width
Call c.setPlotArea(140, 55, 460, 200, &Hffffff, &Heeeeee, cd.LineColor, &Hc0c0c0, &Hc0c0c0 _
).setGridWidth(2, 1, 1, 1)
' swap the x and y axes to create a horziontal box-whisker chart
Call c.swapXY()
' Set the y-axis scale to be date scale from Aug 16, 2004 to Nov 22, 2004, with ticks every 7 days
' (1 week)
Call c.yAxis().setDateScale(DateSerial(2004, 8, 16), DateSerial(2004, 11, 22), 86400 * 7)
' Set multi-style axis label formatting. Month labels are in Arial Bold font in "mmm d" format.
' Weekly labels just show the day of month and use minor tick (by using '-' as first character of
' format string).
Call c.yAxis().setMultiFormat(cd.StartOfMonthFilter(), "<*font=Arial Bold*>{value|mmm d}", _
cd.StartOfDayFilter(), "-{value|d}")
' Set the y-axis to shown on the top (right + swapXY = top)
Call c.setYAxisOnRight()
' Set the labels on the x axis
Call c.xAxis().setLabels(labels)
' Reverse the x-axis scale so that it points downwards.
Call c.xAxis().setReverse()
' Set the horizontal ticks and grid lines to be between the bars
Call c.xAxis().setTickOffset(0.5)
' Add a green (33ff33) box-whisker layer showing the box only.
Call c.addBoxWhiskerLayer(startDate, endDate, Empty, Empty, Empty, &H00cc00, cd.SameAsMainColor, _
cd.SameAsMainColor)
' Output the chart
Set viewer = cd.WebChartViewer(Request, "chart1")
Call viewer.setChart(c, cd.SVG)
' Include tool tip for the chart
viewer.ImageMap = c.getHTMLImageMap("", "", _
"title='{xLabel}: {top|mmm dd, yyyy} to {bottom|mmm dd, yyyy}'")
%>
<!DOCTYPE html>
<html>
<head>
<title>Simple Gantt Chart</title>
<!-- Include ChartDirector Javascript Library to support chart interactions -->
<script type="text/javascript" src="cdjcv.js"></script>
</head>
<body style="margin:5px 0px 0px 5px">
<div style="font:bold 18pt verdana;">
Simple Gantt Chart
</div>
<hr style="border:solid 1px #000080; background:#000080" />
<div style="font:10pt verdana; margin-bottom:1.5em">
<a href="viewsource.asp?file=<%= Request("SCRIPT_NAME") %>">View Chart Source Code</a>
</div>
<!-- ****** Here is the chart image ****** -->
<%= viewer.renderHTML() %>
</body>
</html>
[Windows Version (in Visual Basic)] vbdemo\gantt.cls
Public Sub createChart(viewer As Object, chartIndex As Integer)

    Dim cd As New ChartDirector.API

    ' data for the gantt chart, representing the start date, end date and names for various
    ' activities
    Dim startDate()
    startDate = Array(DateSerial(2004, 8, 16), DateSerial(2004, 8, 30), DateSerial(2004, 9, 13), _
        DateSerial(2004, 9, 20), DateSerial(2004, 9, 27), DateSerial(2004, 10, 4), DateSerial( _
        2004, 10, 25), DateSerial(2004, 11, 1), DateSerial(2004, 11, 8))
    Dim endDate()
    endDate = Array(DateSerial(2004, 8, 30), DateSerial(2004, 9, 13), DateSerial(2004, 9, 27), _
        DateSerial(2004, 10, 4), DateSerial(2004, 10, 11), DateSerial(2004, 11, 8), DateSerial( _
        2004, 11, 8), DateSerial(2004, 11, 22), DateSerial(2004, 11, 22))
    Dim labels()
    labels = Array("Market Research", "Define Specifications", "Overall Archiecture", _
        "Project Planning", "Detail Design", "Software Development", "Test Plan", _
        "Testing and QA", "User Documentation")

    ' Create a XYChart object of size 620 x 280 pixels. Set background color to light blue (ccccff),
    ' with 1 pixel 3D border effect.
    Dim c As XYChart
    Set c = cd.XYChart(620, 280, &Hccccff, &H000000, 1)

    ' Add a title to the chart using 15 points Times Bold Itatic font, with white (ffffff) text on a
    ' deep blue (000080) background
    Call c.addTitle("Simple Gantt Chart Demo", "timesbi.ttf", 15, &Hffffff).setBackground(&H000080)

    ' Set the plotarea at (140, 55) and of size 460 x 200 pixels. Use alternative white/grey
    ' background. Enable both horizontal and vertical grids by setting their colors to grey
    ' (c0c0c0). Set vertical major grid (represents month boundaries) 2 pixels in width
    Call c.setPlotArea(140, 55, 460, 200, &Hffffff, &Heeeeee, cd.LineColor, &Hc0c0c0, &Hc0c0c0 _
        ).setGridWidth(2, 1, 1, 1)

    ' swap the x and y axes to create a horziontal box-whisker chart
    Call c.swapXY()

    ' Set the y-axis scale to be date scale from Aug 16, 2004 to Nov 22, 2004, with ticks every 7
    ' days (1 week)
    Call c.yAxis().setDateScale(DateSerial(2004, 8, 16), DateSerial(2004, 11, 22), 86400 * 7)

    ' Set multi-style axis label formatting. Month labels are in Arial Bold font in "mmm d" format.
    ' Weekly labels just show the day of month and use minor tick (by using '-' as first character
    ' of format string).
    Call c.yAxis().setMultiFormat(cd.StartOfMonthFilter(), "<*font=arialbd.ttf*>{value|mmm d}", _
        cd.StartOfDayFilter(), "-{value|d}")

    ' Set the y-axis to shown on the top (right + swapXY = top)
    Call c.setYAxisOnRight()

    ' Set the labels on the x axis
    Call c.xAxis().setLabels(labels)

    ' Reverse the x-axis scale so that it points downwards.
    Call c.xAxis().setReverse()

    ' Set the horizontal ticks and grid lines to be between the bars
    Call c.xAxis().setTickOffset(0.5)

    ' Add a green (33ff33) box-whisker layer showing the box only.
    Call c.addBoxWhiskerLayer(startDate, endDate, Empty, Empty, Empty, &H00cc00, _
        cd.SameAsMainColor, cd.SameAsMainColor)

    ' Output the chart
    Set viewer.Picture = c.makePicture()

    'include tool tip for the chart
    viewer.ImageMap = c.getHTMLImageMap("clickable", "", _
        "title='{xLabel}: {top|mmm dd, yyyy} to {bottom|mmm dd, yyyy}'")

End Sub
© 2021 Advanced Software Engineering Limited. All rights reserved.