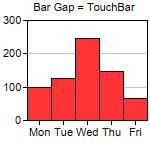
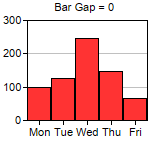
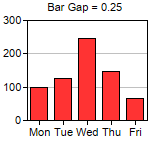
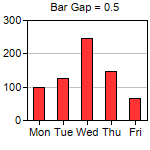
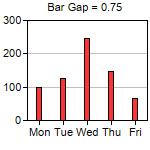
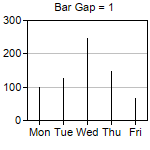
This example demonstrates the effects of different bar gaps configured using BarLayer.setBarGap.
ChartDirector 7.0 (ASP/COM/VB Edition)
Bar Gap
Source Code Listing
<%@ language="vbscript" %>
<%
Set cd = CreateObject("ChartDirector.API")

' This script can draw different charts depending on the chartIndex
Sub createChart(viewer, chartIndex)

    bargap = chartIndex * 0.25 - 0.25

    ' The data for the bar chart
    data = Array(100, 125, 245, 147, 67)

    ' The labels for the bar chart
    labels = Array("Mon", "Tue", "Wed", "Thu", "Fri")

    ' Create a XYChart object of size 150 x 150 pixels
    Set c = cd.XYChart(150, 150)

    ' Set the plotarea at (27, 20) and of size 120 x 100 pixels
    Call c.setPlotArea(27, 20, 120, 100)

    ' Set the labels on the x axis
    Call c.xAxis().setLabels(labels)

    If bargap >= 0 Then
        ' Add a title to display to bar gap using 8pt Arial font
        Call c.addTitle("      Bar Gap = " & bargap, "Arial", 8)
    Else
        ' Use negative value to mean TouchBar
        Call c.addTitle("      Bar Gap = TouchBar", "Arial", 8)
        bargap = cd.TouchBar
    End If

    ' Add a bar chart layer using the given data and set the bar gap
    Call c.addBarLayer(data).setBarGap(bargap)

    ' Output the chart
    Call viewer.setChart(c, cd.SVG)

    ' Include tool tip for the chart
    viewer.ImageMap = c.getHTMLImageMap("", "", "title='Production on {xLabel}: {value} kg'")
End Sub

' This example includes 6 charts
Dim viewers(5)
For i = 0 To Ubound(viewers)
    Set viewers(i) = cd.WebChartViewer(Request, "chart" & i)
    Call createChart(viewers(i), i)
Next
%>

<!DOCTYPE html>
<html>
<head>
    <title>Bar Gap</title>
    <!-- Include ChartDirector Javascript Library to support chart interactions -->
    <script type="text/javascript" src="cdjcv.js"></script>
</head>
<body style="margin:5px 0px 0px 5px">
    <div style="font:bold 18pt verdana;">
        Bar Gap
    </div>
    <hr style="border:solid 1px #000080; background:#000080" />
    <div style="font:10pt verdana; margin-bottom:1.5em">
        <a href="viewsource.asp?file=<%= Request("SCRIPT_NAME") %>">View Chart Source Code</a>
    </div>
    <!-- ****** Here are the chart images ****** -->
    <%
        For i = 0 To Ubound(viewers)
            Call Response.Write(viewers(i).renderHTML())
            Call Response.Write(" ")
        Next
    %>
</body>
</html>Public Sub createChart(viewer As Object, chartIndex As Integer)
Dim cd As New ChartDirector.API
Dim bargap As Double
bargap = chartIndex * 0.25 - 0.25
' The data for the bar chart
Dim data()
data = Array(100, 125, 245, 147, 67)
' The labels for the bar chart
Dim labels()
labels = Array("Mon", "Tue", "Wed", "Thu", "Fri")
' Create a XYChart object of size 150 x 150 pixels
Dim c As XYChart
Set c = cd.XYChart(150, 150)
' Set the plotarea at (27, 20) and of size 120 x 100 pixels
Call c.setPlotArea(27, 20, 120, 100)
' Set the labels on the x axis
Call c.xAxis().setLabels(labels)
If bargap >= 0 Then
' Add a title to display to bar gap using 8pt Arial font
Call c.addTitle(" Bar Gap = " & bargap, "arial.ttf", 8)
Else
' Use negative value to mean TouchBar
Call c.addTitle(" Bar Gap = TouchBar", "arial.ttf", 8)
bargap = cd.TouchBar
End If
' Add a bar chart layer using the given data and set the bar gap
Call c.addBarLayer(data).setBarGap(bargap)
' Output the chart
Set viewer.Picture = c.makePicture()
'include tool tip for the chart
viewer.ImageMap = c.getHTMLImageMap("clickable", "", _
"title='Production on {xLabel}: {value} kg'")
End Sub