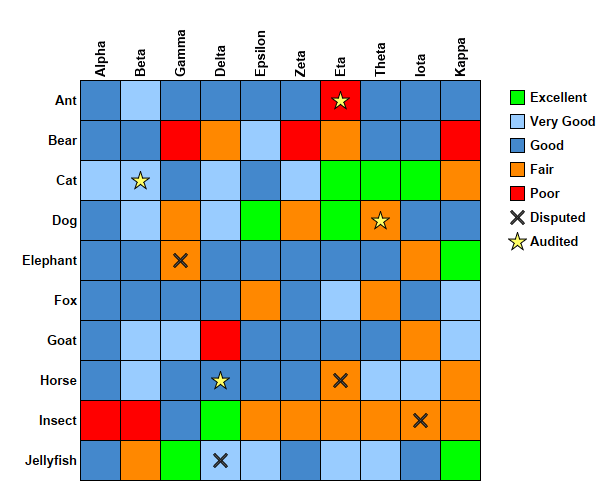
This example demonstrates adding symbols and custom legend keys to the discrete heat map.
[Web Version (in ASP)] aspdemo\heatmapcellsymbols.asp
<%@ language="vbscript" %>
<%
Set cd = CreateObject("ChartDirector.API")

' The x-axis and y-axis labels
xLabels = Array("Alpha", "Beta", "Gamma", "Delta", "Epsilon", "Zeta", "Eta", "Theta", "Iota", _
    "Kappa")
yLabels = Array("Ant", "Bear", "Cat", "Dog", "Elephant", "Fox", "Goat", "Horse", "Insect", _
    "Jellyfish")

' Random data for the 10 x 10 cells
Set rand = cd.RanSeries(2)
zData = rand.getSeries((UBound(xLabels) + 1) * (UBound(yLabels) + 1), 0, 10)

' The coordinates for the first set of scatter symbols
symbolX = Array(2.5, 6.5, 3.5, 8.5)
symbolY = Array(4.5, 7.5, 9.5, 8.5)

' The coordinates for the second set of scatter symbols
symbol2X = Array(6.5, 3.5, 7.5, 1.5)
symbol2Y = Array(0.5, 7.5, 3.5, 2.5)

' Create an XYChart object of size 600 x 500 pixels.
Set c = cd.XYChart(600, 500)

' Set the plotarea at (80, 80) and of size 400 x 400 pixels. Set the background, border, and grid
' lines to transparent.
Set p = c.setPlotArea(80, 80, 400, 400, -1, -1, cd.Transparent, cd.Transparent)

' Add the first set of scatter symbols. Use grey (0x555555) cross shape symbols.
Call c.addScatterLayer(symbolX, symbolY, "Disputed", cd.Cross2Shape(0.2), 15, &H555555 _
    ).setHTMLImageMap("{disable}")

' Add the first set of scatter symbols. Use yellow (0xffff66) star shape symbols.
Call c.addScatterLayer(symbol2X, symbol2Y, "Audited", cd.StarShape(5), 19, &Hffff66 _
    ).setHTMLImageMap("{disable}")

' Create a discrete heat map with 10 x 10 cells
Set layer = c.addDiscreteHeatMapLayer(zData, UBound(xLabels) + 1)

' Set the x-axis labels. Use 10pt Arial Bold font rotated by 90 degrees. Set axis stem to
' transparent, so only the labels are visible. Set 0.5 offset to position the labels in between the
' grid lines. Position the x-axis at the top of the chart.
Call c.xAxis().setLabels(xLabels)
Call c.xAxis().setLabelStyle("Arial Bold", 10, cd.TextColor, 90)
Call c.xAxis().setColors(cd.Transparent, cd.TextColor)
Call c.xAxis().setLabelOffset(0.5)
Call c.setXAxisOnTop()

' Set the y-axis labels. Use 10pt Arial Bold font. Set axis stem to transparent, so only the labels
' are visible. Set 0.5 offset to position the labels in between the grid lines. Reverse the y-axis
' so that the labels are flowing top-down instead of bottom-up.
Call c.yAxis().setLabels(yLabels)
Call c.yAxis().setLabelStyle("Arial Bold", 10)
Call c.yAxis().setColors(cd.Transparent, cd.TextColor)
Call c.yAxis().setLabelOffset(0.5)
Call c.yAxis().setReverse()

' Set the color stops and scale
colorScale = Array(0, &Hff0000, 1, &Hff8800, 3, &H4488cc, 7, &H99ccff, 9, &H00ff00, 10)
colorLabels = Array("Poor", "Fair", "Good", "Very Good", "Excellent")
Call layer.colorAxis().setColorScale(colorScale)

' Position the legend box 20 pixels to the right of the plot area. Use 10pt Arial Bold font. Set the
' key icon size to 15 x 15 pixels. Set vertical key spacing to 8 pixels.
Set b = c.addLegend(p.getRightX() + 20, p.getTopY(), True, "Arial Bold", 10)
Call b.setBackground(cd.Transparent, cd.Transparent)
Call b.setKeySize(15, 15)
Call b.setKeySpacing(0, 8)

' Add the color scale label to the legend box
For i = UBound(colorLabels) To 0 Step -1
    Call b.addKey(colorLabels(i), Int(colorScale(i * 2 + 1)))
Next

' Output the chart
Set viewer = cd.WebChartViewer(Request, "chart1")
Call viewer.setChart(c, cd.SVG)

' Include tool tip for the chart
viewer.ImageMap = c.getHTMLImageMap("", "", "title='<*cdml*>({xLabel}, {yLabel}) = {z|2}'")
%>

<!DOCTYPE html>
<html>
<head>
    <title>Heat Map Cell Symbols</title>
    <!-- Include ChartDirector Javascript Library to support chart interactions -->
    <script type="text/javascript" src="cdjcv.js"></script>
</head>
<body style="margin:5px 0px 0px 5px">
    <div style="font:bold 18pt verdana;">
        Heat Map Cell Symbols
    </div>
    <hr style="border:solid 1px #000080; background:#000080" />
    <div style="font:10pt verdana; margin-bottom:1.5em">
        <a href="viewsource.asp?file=<%= Request("SCRIPT_NAME") %>">View Chart Source Code</a>
    </div>
    <!-- ****** Here is the chart image ****** -->
    <%= viewer.renderHTML() %>
</body>
</html>
© 2021 Advanced Software Engineering Limited. All rights reserved.