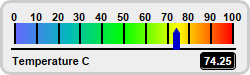
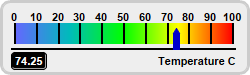
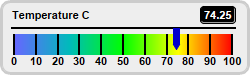
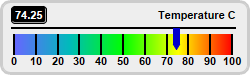
This example demonstrates horizontal linear meters in different orientations.
In a horizontal linear meter, the scale labels can be positioned above the meter scale or below it. This is controlled by the last argument to
LinearMeter.setMeter, which can be
Top or
Bottom,
The title and value readout added using
BaseChart.addText can be put at any position. In this example, we put them at the opposite side to the scale labels.
[Web Version (in ASP)] aspdemo\hlinearmeterorientation.asp
<%@ language="vbscript" %>
<%
Set cd = CreateObject("ChartDirector.API")

' This script can draw different charts depending on the chartIndex
Sub createChart(viewer, chartIndex)

    ' The value to display on the meter
    value = 74.25

    ' Create a LinearMeter object of size 250 x 75 pixels with very light grey (0xeeeeee) backgruond
    ' and a light grey (0xccccccc) 3-pixel thick rounded frame
    Set m = cd.LinearMeter(250, 75, &Heeeeee, &Hcccccc)
    Call m.setRoundedFrame(cd.Transparent)
    Call m.setThickFrame(3)

    ' This example demonstrates putting the text labels at the top or bottom. This is by setting the
    ' label alignment, scale position and label position.
    alignment = Array(cd.Top, cd.Top, cd.Bottom, cd.Bottom)
    meterYPos = Array(23, 23, 34, 34)
    labelYPos = Array(61, 61, 15, 15)

    ' Set the scale region
    Call m.setMeter(14, meterYPos(chartIndex), 218, 20, alignment(chartIndex))

    ' Set meter scale from 0 - 100, with a tick every 10 units
    Call m.setScale(0, 100, 10)

    ' Add a smooth color scale at the default position
    smoothColorScale = Array(0, &H6666ff, 25, &H00bbbb, 50, &H00ff00, 75, &Hffff00, 100, &Hff0000)
    Call m.addColorScale(smoothColorScale)

    ' Add a blue (0x0000cc) pointer at the specified value
    Call m.addPointer(value, &H0000cc)

    '
    ' In this example, some charts have the "Temperauture" label on the left side and the value
    ' readout on the right side, and some charts have the reverse
    '

    If chartIndex Mod 2 = 0 Then
        ' Add a label on the left side using 8pt Arial Bold font
        Call m.addText(10, labelYPos(chartIndex), "Temperature C", "Arial Bold", 8, cd.TextColor, _
            cd.Left)

        ' Add a text box on the right side. Display the value using white (0xffffff) 8pt Arial Bold
        ' font on a black (0x000000) background with depressed rounded border.
        Set t = m.addText(235, labelYPos(chartIndex), m.formatValue(value, "2"), "Arial Bold", 8, _
            &Hffffff, cd.Right)
        Call t.setBackground(&H000000, &H000000, -1)
        Call t.setRoundedCorners(3)
    Else
        ' Add a label on the right side using 8pt Arial Bold font
        Call m.addText(237, labelYPos(chartIndex), "Temperature C", "Arial Bold", 8, cd.TextColor, _
            cd.Right)

        ' Add a text box on the left side. Display the value using white (0xffffff) 8pt Arial Bold
        ' font on a black (0x000000) background with depressed rounded border.
        Set t = m.addText(11, labelYPos(chartIndex), m.formatValue(value, "2"), "Arial Bold", 8, _
            &Hffffff, cd.Left)
        Call t.setBackground(&H000000, &H000000, -1)
        Call t.setRoundedCorners(3)
    End If

    ' Output the chart
    Call viewer.setChart(m, cd.SVG)
End Sub

' This example includes 4 charts
Dim viewers(3)
For i = 0 To Ubound(viewers)
    Set viewers(i) = cd.WebChartViewer(Request, "chart" & i)
    Call createChart(viewers(i), i)
Next
%>

<!DOCTYPE html>
<html>
<head>
    <title>H-Linear Meter Orientation</title>
    <!-- Include ChartDirector Javascript Library to support chart interactions -->
    <script type="text/javascript" src="cdjcv.js"></script>
</head>
<body style="margin:5px 0px 0px 5px">
    <div style="font:bold 18pt verdana;">
        H-Linear Meter Orientation
    </div>
    <hr style="border:solid 1px #000080; background:#000080" />
    <div style="font:10pt verdana; margin-bottom:1.5em">
        <a href="viewsource.asp?file=<%= Request("SCRIPT_NAME") %>">View Chart Source Code</a>
    </div>
    <!-- ****** Here are the chart images ****** -->
    <%
        For i = 0 To Ubound(viewers)
            Call Response.Write(viewers(i).renderHTML())
            Call Response.Write(" ")
        Next
    %>
</body>
</html>
[Windows Version (in Visual Basic)] vbdemo\hlinearmeterorientation.cls
Public Sub createChart(viewer As Object, chartIndex As Integer)

    Dim cd As New ChartDirector.API

    ' The value to display on the meter
    Dim value As Double
    value = 74.25

    ' Create a LinearMeter object of size 250 x 75 pixels with very light grey (0xeeeeee) backgruond
    ' and a light grey (0xccccccc) 3-pixel thick rounded frame
    Dim m As LinearMeter
    Set m = cd.LinearMeter(250, 75, &Heeeeee, &Hcccccc)
    Call m.setRoundedFrame()
    Call m.setThickFrame(3)

    ' This example demonstrates putting the text labels at the top or bottom. This is by setting the
    ' label alignment, scale position and label position.
    Dim alignment()
    alignment = Array(cd.Top, cd.Top, cd.Bottom, cd.Bottom)
    Dim meterYPos()
    meterYPos = Array(23, 23, 34, 34)
    Dim labelYPos()
    labelYPos = Array(61, 61, 15, 15)

    ' Set the scale region
    Call m.setMeter(14, meterYPos(chartIndex), 218, 20, alignment(chartIndex))

    ' Set meter scale from 0 - 100, with a tick every 10 units
    Call m.setScale(0, 100, 10)

    ' Add a smooth color scale at the default position
    Dim smoothColorScale()
    smoothColorScale = Array(0, &H6666ff, 25, &H00bbbb, 50, &H00ff00, 75, &Hffff00, 100, &Hff0000)
    Call m.addColorScale(smoothColorScale)

    ' Add a blue (0x0000cc) pointer at the specified value
    Call m.addPointer(value, &H0000cc)

    '
    ' In this example, some charts have the "Temperauture" label on the left side and the value
    ' readout on the right side, and some charts have the reverse
    '

    If chartIndex Mod 2 = 0 Then
        ' Add a label on the left side using 8pt Arial Bold font
        Call m.addText(10, labelYPos(chartIndex), "Temperature C", "arialbd.ttf", 8, cd.TextColor, _
            cd.Left)

        ' Add a text box on the right side. Display the value using white (0xffffff) 8pt Arial Bold
        ' font on a black (0x000000) background with depressed rounded border.
        Dim t As ChartDirector.TextBox
        Set t = m.addText(235, labelYPos(chartIndex), m.formatValue(value, "2"), "arialbd.ttf", 8, _
            &Hffffff, cd.Right)
        Call t.setBackground(&H000000, &H000000, -1)
        Call t.setRoundedCorners(3)
    Else
        ' Add a label on the right side using 8pt Arial Bold font
        Call m.addText(237, labelYPos(chartIndex), "Temperature C", "arialbd.ttf", 8, _
            cd.TextColor, cd.Right)

        ' Add a text box on the left side. Display the value using white (0xffffff) 8pt Arial Bold
        ' font on a black (0x000000) background with depressed rounded border.
        Set t = m.addText(11, labelYPos(chartIndex), m.formatValue(value, "2"), "arialbd.ttf", 8, _
            &Hffffff, cd.Left)
        Call t.setBackground(&H000000, &H000000, -1)
        Call t.setRoundedCorners(3)
    End If

    ' Output the chart
    Set viewer.Picture = m.makePicture()

End Sub
© 2021 Advanced Software Engineering Limited. All rights reserved.