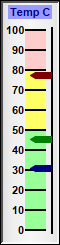
This example demonstrates a vertical linear meter with multiple pointers.
ChartDirector 7.0 (ASP/COM/VB Edition)
Multi-Pointer Vertical Meter
Source Code Listing
<%@ language="vbscript" %>
<%
Set cd = CreateObject("ChartDirector.API")

' The values to display on the meter
value0 = 30.99
value1 = 45.35
value2 = 77.64

' Create an LinearMeter object of size 60 x 245 pixels, using silver background with a 2 pixel black
' 3D depressed border.
Set m = cd.LinearMeter(60, 245, cd.silverColor(), 0, -2)

' Set the scale region top-left corner at (25, 30), with size of 20 x 200 pixels. The scale labels
' are located on the left (default - implies vertical meter)
Call m.setMeter(25, 30, 20, 200)

' Set meter scale from 0 - 100, with a tick every 10 units
Call m.setScale(0, 100, 10)

' Set 0 - 50 as green (99ff99) zone, 50 - 80 as yellow (ffff66) zone, and 80 - 100 as red (ffcccc)
' zone
Call m.addZone(0, 50, &H99ff99)
Call m.addZone(50, 80, &Hffff66)
Call m.addZone(80, 100, &Hffcccc)

' Add deep red (000080), deep green (008000) and deep blue (800000) pointers to reflect the values
Call m.addPointer(value0, &H000080)
Call m.addPointer(value1, &H008000)
Call m.addPointer(value2, &H800000)

' Add a text box label at top-center (30, 5) using Arial Bold/8pt/deep blue (000088), with a light
' blue (9999ff) background
Call m.addText(30, 5, "Temp C", "Arial Bold", 8, &H000088, cd.TopCenter).setBackground(&H9999ff)

' Output the chart
Set viewer = cd.WebChartViewer(Request, "chart1")
Call viewer.setChart(m, cd.SVG)
%>

<!DOCTYPE html>
<html>
<head>
    <title>Multi-Pointer Vertical Meter</title>
    <!-- Include ChartDirector Javascript Library to support chart interactions -->
    <script type="text/javascript" src="cdjcv.js"></script>
</head>
<body style="margin:5px 0px 0px 5px">
    <div style="font:bold 18pt verdana;">
        Multi-Pointer Vertical Meter
    </div>
    <hr style="border:solid 1px #000080; background:#000080" />
    <div style="font:10pt verdana; margin-bottom:1.5em">
        <a href="viewsource.asp?file=<%= Request("SCRIPT_NAME") %>">View Chart Source Code</a>
    </div>
    <!-- ****** Here is the chart image ****** -->
    <%= viewer.renderHTML() %>
</body>
</html>Public Sub createChart(viewer As Object, chartIndex As Integer)
Dim cd As New ChartDirector.API
' The values to display on the meter
Dim value0 As Double
value0 = 30.99
Dim value1 As Double
value1 = 45.35
Dim value2 As Double
value2 = 77.64
' Create an LinearMeter object of size 60 x 245 pixels, using silver background with a 2 pixel
' black 3D depressed border.
Dim m As LinearMeter
Set m = cd.LinearMeter(60, 245, cd.silverColor(), 0, -2)
' Set the scale region top-left corner at (25, 30), with size of 20 x 200 pixels. The scale
' labels are located on the left (default - implies vertical meter)
Call m.setMeter(25, 30, 20, 200)
' Set meter scale from 0 - 100, with a tick every 10 units
Call m.setScale(0, 100, 10)
' Set 0 - 50 as green (99ff99) zone, 50 - 80 as yellow (ffff66) zone, and 80 - 100 as red
' (ffcccc) zone
Call m.addZone(0, 50, &H99ff99)
Call m.addZone(50, 80, &Hffff66)
Call m.addZone(80, 100, &Hffcccc)
' Add deep red (000080), deep green (008000) and deep blue (800000) pointers to reflect the
' values
Call m.addPointer(value0, &H000080)
Call m.addPointer(value1, &H008000)
Call m.addPointer(value2, &H800000)
' Add a text box label at top-center (30, 5) using Arial Bold/8pt/deep blue (000088), with a
' light blue (9999ff) background
Call m.addText(30, 5, "Temp C", "arialbd.ttf", 8, &H000088, cd.TopCenter).setBackground( _
&H9999ff)
' Output the chart
Set viewer.Picture = m.makePicture()
End Sub