[Web Version (in ASP)] aspdemo\polarscatter.asp
<%@ language="vbscript" %>
<%
Set cd = CreateObject("ChartDirector.API")
' The data for the chart
data0 = Array(43, 89, 76, 64, 48, 18, 92, 68, 44, 79, 71, 85)
angles0 = Array(45, 96, 169, 258, 15, 30, 330, 260, 60, 75, 110, 140)
data1 = Array(50, 91, 26, 29, 80, 53, 62, 87, 19, 40)
angles1 = Array(230, 210, 240, 310, 179, 250, 244, 199, 89, 160)
data2 = Array(88, 65, 76, 49, 80, 53)
angles2 = Array(340, 310, 340, 210, 30, 300)
' The labels on the angular axis (spokes)
labels = Array("North", "North<*br*>East", "East", "South<*br*>East", "South", "South<*br*>West", _
"West", "North<*br*>West")
' Create a PolarChart object of size 460 x 460 pixels
Set c = cd.PolarChart(460, 460)
' Add a title to the chart at the top left corner using 15pt Arial Bold Italic font
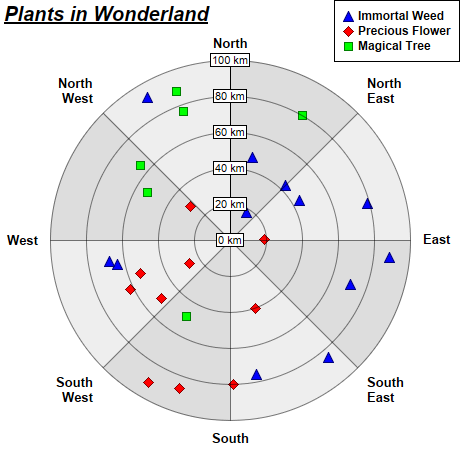
Call c.addTitle2(cd.TopLeft, "<*underline=2*>Plants in Wonderland", "Arial Bold Italic", 15)
' Set center of plot area at (230, 240) with radius 180 pixels
Call c.setPlotArea(230, 240, 180)
' Use alternative light grey/dark grey sector background color
Call c.setPlotAreaBg(&Hdddddd, &Heeeeee, False)
' Set the grid style to circular grid
Call c.setGridStyle(False)
' Add a legend box at the top right corner of the chart using 9pt Arial Bold font
Call c.addLegend(459, 0, True, "Arial Bold", 9).setAlignment(cd.TopRight)
' Set angular axis as 0 - 360, either 8 spokes
Call c.angularAxis().setLinearScale2(0, 360, labels)
' Set the radial axis label format
Call c.radialAxis().setLabelFormat("{value} km")
' Add a blue (0xff) polar line layer to the chart using (data0, angle0)
Set layer0 = c.addLineLayer(data0, &H0000ff, "Immortal Weed")
Call layer0.setAngles(angles0)
Call layer0.setLineWidth(0)
Call layer0.setDataSymbol(cd.TriangleSymbol, 11)
' Add a red (0xff0000) polar line layer to the chart using (data1, angles1)
Set layer1 = c.addLineLayer(data1, &Hff0000, "Precious Flower")
Call layer1.setAngles(angles1)
' Disable the line by setting its width to 0, so only the symbols are visible
Call layer1.setLineWidth(0)
' Use a 11 pixel diamond data point symbol
Call layer1.setDataSymbol(cd.DiamondSymbol, 11)
' Add a green (0x00ff00) polar line layer to the chart using (data2, angles2)
Set layer2 = c.addLineLayer(data2, &H00ff00, "Magical Tree")
Call layer2.setAngles(angles2)
' Disable the line by setting its width to 0, so only the symbols are visible
Call layer2.setLineWidth(0)
' Use a 9 pixel square data point symbol
Call layer2.setDataSymbol(cd.SquareSymbol, 9)
' Output the chart
Set viewer = cd.WebChartViewer(Request, "chart1")
Call viewer.setChart(c, cd.SVG)
' Include tool tip for the chart
viewer.ImageMap = c.getHTMLImageMap("", "", "title='{dataSetName} at ({value} km, {angle} deg)'")
%>
<!DOCTYPE html>
<html>
<head>
<title>Polar Scatter Chart</title>
<!-- Include ChartDirector Javascript Library to support chart interactions -->
<script type="text/javascript" src="cdjcv.js"></script>
</head>
<body style="margin:5px 0px 0px 5px">
<div style="font:bold 18pt verdana;">
Polar Scatter Chart
</div>
<hr style="border:solid 1px #000080; background:#000080" />
<div style="font:10pt verdana; margin-bottom:1.5em">
<a href="viewsource.asp?file=<%= Request("SCRIPT_NAME") %>">View Chart Source Code</a>
</div>
<!-- ****** Here is the chart image ****** -->
<%= viewer.renderHTML() %>
</body>
</html>
[Windows Version (in Visual Basic)] vbdemo\polarscatter.cls
Public Sub createChart(viewer As Object, chartIndex As Integer)

    Dim cd As New ChartDirector.API

    ' The data for the chart
    Dim data0()
    data0 = Array(43, 89, 76, 64, 48, 18, 92, 68, 44, 79, 71, 85)
    Dim angles0()
    angles0 = Array(45, 96, 169, 258, 15, 30, 330, 260, 60, 75, 110, 140)

    Dim data1()
    data1 = Array(50, 91, 26, 29, 80, 53, 62, 87, 19, 40)
    Dim angles1()
    angles1 = Array(230, 210, 240, 310, 179, 250, 244, 199, 89, 160)

    Dim data2()
    data2 = Array(88, 65, 76, 49, 80, 53)
    Dim angles2()
    angles2 = Array(340, 310, 340, 210, 30, 300)

    ' The labels on the angular axis (spokes)
    Dim labels()
    labels = Array("North", "North<*br*>East", "East", "South<*br*>East", "South", _
        "South<*br*>West", "West", "North<*br*>West")

    ' Create a PolarChart object of size 460 x 460 pixels
    Dim c As PolarChart
    Set c = cd.PolarChart(460, 460)

    ' Add a title to the chart at the top left corner using 15pt Arial Bold Italic font
    Call c.addTitle2(cd.TopLeft, "<*underline=2*>Plants in Wonderland", "arialbi.ttf", 15)

    ' Set center of plot area at (230, 240) with radius 180 pixels
    Call c.setPlotArea(230, 240, 180)

    ' Use alternative light grey/dark grey sector background color
    Call c.setPlotAreaBg(&Hdddddd, &Heeeeee, False)

    ' Set the grid style to circular grid
    Call c.setGridStyle(False)

    ' Add a legend box at the top right corner of the chart using 9pt Arial Bold font
    Call c.addLegend(459, 0, True, "arialbd.ttf", 9).setAlignment(cd.TopRight)

    ' Set angular axis as 0 - 360, either 8 spokes
    Call c.angularAxis().setLinearScale2(0, 360, labels)

    ' Set the radial axis label format
    Call c.radialAxis().setLabelFormat("{value} km")

    ' Add a blue (0xff) polar line layer to the chart using (data0, angle0)
    Dim layer0 As PolarLineLayer
    Set layer0 = c.addLineLayer(data0, &H0000ff, "Immortal Weed")
    Call layer0.setAngles(angles0)

    Call layer0.setLineWidth(0)
    Call layer0.setDataSymbol(cd.TriangleSymbol, 11)

    ' Add a red (0xff0000) polar line layer to the chart using (data1, angles1)
    Dim layer1 As PolarLineLayer
    Set layer1 = c.addLineLayer(data1, &Hff0000, "Precious Flower")
    Call layer1.setAngles(angles1)

    ' Disable the line by setting its width to 0, so only the symbols are visible
    Call layer1.setLineWidth(0)

    ' Use a 11 pixel diamond data point symbol
    Call layer1.setDataSymbol(cd.DiamondSymbol, 11)

    ' Add a green (0x00ff00) polar line layer to the chart using (data2, angles2)
    Dim layer2 As PolarLineLayer
    Set layer2 = c.addLineLayer(data2, &H00ff00, "Magical Tree")
    Call layer2.setAngles(angles2)

    ' Disable the line by setting its width to 0, so only the symbols are visible
    Call layer2.setLineWidth(0)

    ' Use a 9 pixel square data point symbol
    Call layer2.setDataSymbol(cd.SquareSymbol, 9)

    ' Output the chart
    Set viewer.Picture = c.makePicture()

    'include tool tip for the chart
    viewer.ImageMap = c.getHTMLImageMap("clickable", "", _
        "title='{dataSetName} at ({value} km, {angle} deg)'")

End Sub
© 2021 Advanced Software Engineering Limited. All rights reserved.