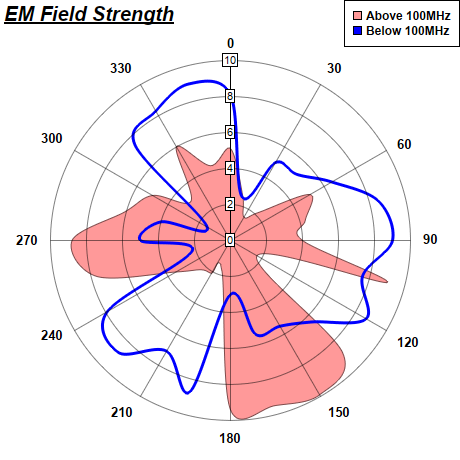
This example demonstrates polar spline line and polar spline area.
The polar spline line is created using PolarChart.addSplineLineLayer. The polar spline area is created using PolarChart.addSplineAreaLayer.
ChartDirector 7.0 (ASP/COM/VB Edition)
Polar Spline Chart
Source Code Listing
<%@ language="vbscript" %>
<%
Set cd = CreateObject("ChartDirector.API")

' The data for the chart
data0 = Array(5.1, 2.6, 1.5, 2.2, 5.1, 4.3, 4.0, 9.0, 1.7, 8.8, 9.9, 9.5, 9.4, 1.8, 2.1, 2.3, 3.5, _
    7.7, 8.8, 6.1, 5.0, 3.1, 6.0, 4.3)
angles0 = Array(0, 15, 30, 45, 60, 75, 90, 105, 120, 135, 150, 165, 180, 195, 210, 225, 240, 255, _
    270, 285, 300, 315, 330, 345)

data1 = Array(8.1, 2.5, 5, 5.2, 6.5, 8.5, 9, 7.6, 8.7, 6.4, 5.5, 5.4, 3.0, 8.7, 7.1, 8.8, 7.9, _
    2.2, 5.0, 4.0, 1.5, 7.5, 8.3, 9.0)
angles1 = Array(0, 15, 30, 45, 60, 75, 90, 105, 120, 135, 150, 165, 180, 195, 210, 225, 240, 255, _
    270, 285, 300, 315, 330, 345)

' Create a PolarChart object of size 460 x 460 pixels
Set c = cd.PolarChart(460, 460)

' Add a title to the chart at the top left corner using 15pt Arial Bold Italic font
Call c.addTitle2(cd.TopLeft, "<*underline=2*>EM Field Strength", "Arial Bold Italic", 15)

' Set center of plot area at (230, 240) with radius 180 pixels
Call c.setPlotArea(230, 240, 180)

' Set the grid style to circular grid
Call c.setGridStyle(False)

' Add a legend box at the top right corner of the chart using 9pt Arial Bold font
Call c.addLegend(459, 0, True, "Arial Bold", 9).setAlignment(cd.TopRight)

' Set angular axis as 0 - 360, with a spoke every 30 units
Call c.angularAxis().setLinearScale(0, 360, 30)

' Add a red (0xff9999) spline area layer to the chart using (data0, angles0)
Call c.addSplineAreaLayer(data0, &Hff9999, "Above 100MHz").setAngles(angles0)

' Add a blue (0xff) spline line layer to the chart using (data1, angle1)
Set layer1 = c.addSplineLineLayer(data1, &H0000ff, "Below 100MHz")
Call layer1.setAngles(angles1)

' Set the line width to 3 pixels
Call layer1.setLineWidth(3)

' Output the chart
Set viewer = cd.WebChartViewer(Request, "chart1")
Call viewer.setChart(c, cd.SVG)

' Include tool tip for the chart
viewer.ImageMap = c.getHTMLImageMap("", "", _
    "title='{dataSetName} EM field at {angle} deg: {value} Watt'")
%>

<!DOCTYPE html>
<html>
<head>
    <title>Polar Spline Chart</title>
    <!-- Include ChartDirector Javascript Library to support chart interactions -->
    <script type="text/javascript" src="cdjcv.js"></script>
</head>
<body style="margin:5px 0px 0px 5px">
    <div style="font:bold 18pt verdana;">
        Polar Spline Chart
    </div>
    <hr style="border:solid 1px #000080; background:#000080" />
    <div style="font:10pt verdana; margin-bottom:1.5em">
        <a href="viewsource.asp?file=<%= Request("SCRIPT_NAME") %>">View Chart Source Code</a>
    </div>
    <!-- ****** Here is the chart image ****** -->
    <%= viewer.renderHTML() %>
</body>
</html>Public Sub createChart(viewer As Object, chartIndex As Integer)
Dim cd As New ChartDirector.API
' The data for the chart
Dim data0()
data0 = Array(5.1, 2.6, 1.5, 2.2, 5.1, 4.3, 4.0, 9.0, 1.7, 8.8, 9.9, 9.5, 9.4, 1.8, 2.1, 2.3, _
3.5, 7.7, 8.8, 6.1, 5.0, 3.1, 6.0, 4.3)
Dim angles0()
angles0 = Array(0, 15, 30, 45, 60, 75, 90, 105, 120, 135, 150, 165, 180, 195, 210, 225, 240, _
255, 270, 285, 300, 315, 330, 345)
Dim data1()
data1 = Array(8.1, 2.5, 5, 5.2, 6.5, 8.5, 9, 7.6, 8.7, 6.4, 5.5, 5.4, 3.0, 8.7, 7.1, 8.8, 7.9, _
2.2, 5.0, 4.0, 1.5, 7.5, 8.3, 9.0)
Dim angles1()
angles1 = Array(0, 15, 30, 45, 60, 75, 90, 105, 120, 135, 150, 165, 180, 195, 210, 225, 240, _
255, 270, 285, 300, 315, 330, 345)
' Create a PolarChart object of size 460 x 460 pixels
Dim c As PolarChart
Set c = cd.PolarChart(460, 460)
' Add a title to the chart at the top left corner using 15pt Arial Bold Italic font
Call c.addTitle2(cd.TopLeft, "<*underline=2*>EM Field Strength", "arialbi.ttf", 15)
' Set center of plot area at (230, 240) with radius 180 pixels
Call c.setPlotArea(230, 240, 180)
' Set the grid style to circular grid
Call c.setGridStyle(False)
' Add a legend box at the top right corner of the chart using 9pt Arial Bold font
Call c.addLegend(459, 0, True, "arialbd.ttf", 9).setAlignment(cd.TopRight)
' Set angular axis as 0 - 360, with a spoke every 30 units
Call c.angularAxis().setLinearScale(0, 360, 30)
' Add a red (0xff9999) spline area layer to the chart using (data0, angles0)
Call c.addSplineAreaLayer(data0, &Hff9999, "Above 100MHz").setAngles(angles0)
' Add a blue (0xff) spline line layer to the chart using (data1, angle1)
Dim layer1 As PolarSplineLineLayer
Set layer1 = c.addSplineLineLayer(data1, &H0000ff, "Below 100MHz")
Call layer1.setAngles(angles1)
' Set the line width to 3 pixels
Call layer1.setLineWidth(3)
' Output the chart
Set viewer.Picture = c.makePicture()
'include tool tip for the chart
viewer.ImageMap = c.getHTMLImageMap("clickable", "", _
"title='{dataSetName} EM field at {angle} deg: {value} Watt'")
End Sub